Tag Archives: Equity

Palantir files to go public

I am not sure this was worth a post as there is nothing really surprising with Palantir IPO filing that can be found here on the NASDAQ website. Still, this is Palantir, the secretive software company cofounded by Peter Thiel, Alexander Karp & Stephen Cohen (as well as Joe Lonsdale and Nathan Gettings)


Thiel, Karp, Lonsdale & Cohen (Gettings cannot be found online)

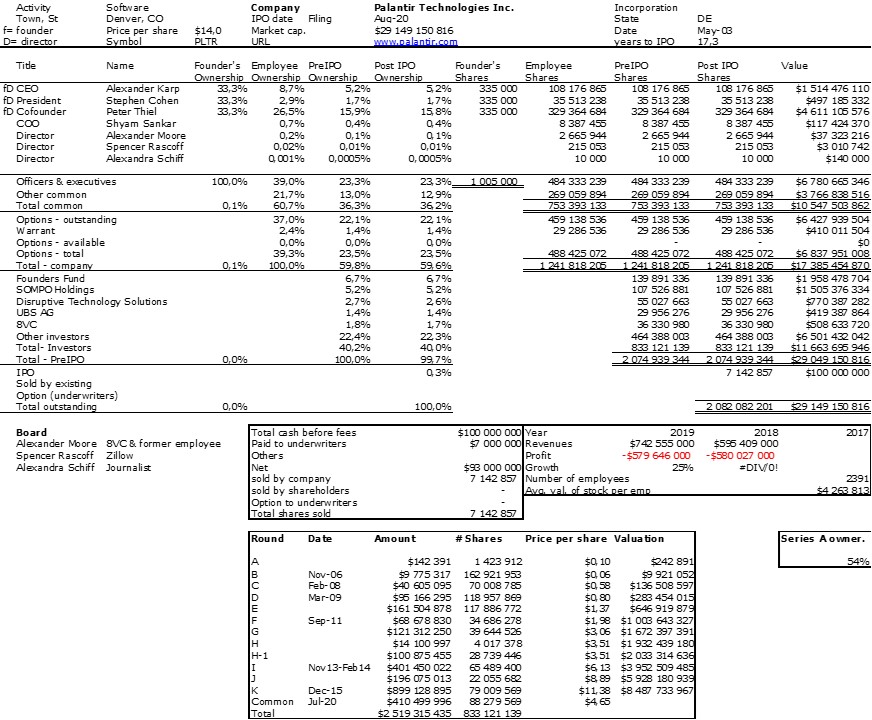
So I did my favorite exercise, building a tentative cap. table. Here it is:

What are the striking facts: the high level of sales, losses and fund raising. The startup, neither its founders are not young anymore… That’s it. Or feel free to comment!

The dark and mysterious side of British unicorns : Darktrace Ltd

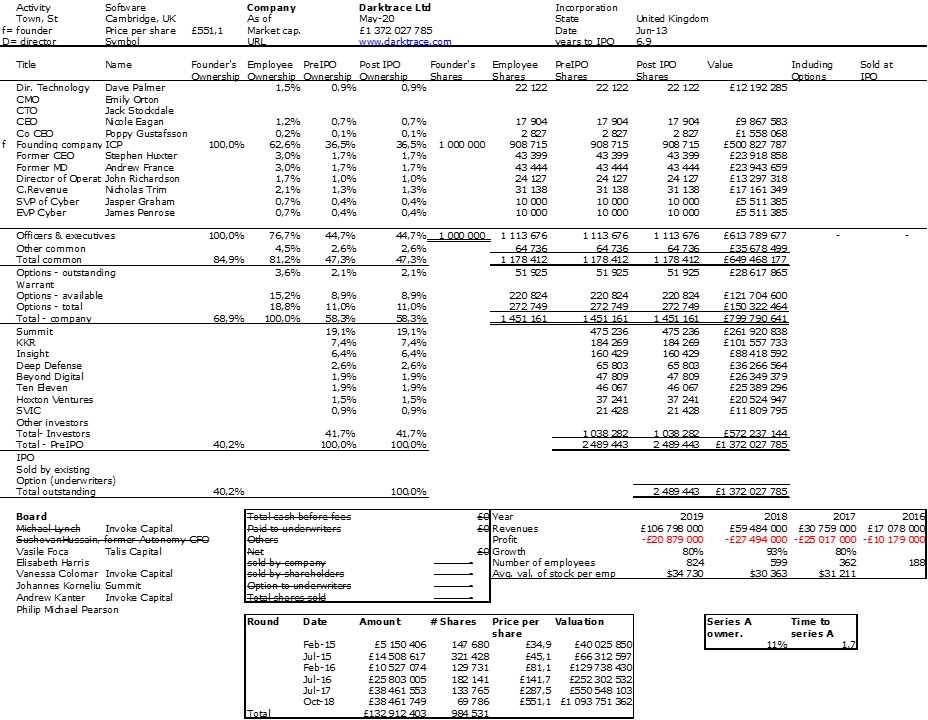
My naive and obsessive quest for startup cap. tables has led me today to a thriller-like research! First I will let you have a look at Darktrace cap. table which I decided to study as it belongs to the short list of UK unicorns together with Revolut and Graphcore.

Well the first surprising information is the founding structure, ICP London. Why a British Virgin Islands structure? To hide who the founders are? Then I discovered surprising board members, Michael Lynch, the founder of Autonomy and Sushovan Hussain, the former Autonomy CFO… Autonomy was always a puzzle to me before becoming a scandalous HP acquisition and then the cause of a huge trial, not decided yet… And in law, you are innocent unless proven guilty.

Another strange side of the company is its links to secret services, MI5, CIA, NSA. Probably not so surprising when your industry is cybersecurity… Being based in Cambridge, it is not surprising that many Darktrace employees were at Autonomy before. The board members I did not know, but the investors are famous: Summit, KKR, Insight. Less maybe is Invoke Capital board members Vanessa Colomar and Andrew Camper. Lynch and Hussain are not on the board anymore and this is probably linked to the HP Autonomy litigation.

Then I got it: Invoke Capital Partners… ICP! So Darktrace was indeed founded by the former Autonomy people and its new investment structure, Invoke. I had to do a little more search and found two quite fascinating articles:

Skeletons In The Closet: $2 Billion Cybersecurity Firm Darktrace Haunted By Characters From HP’s Failed Autonomy Deal, a remarkable enquiry published in Feb. 2020 by Forbes staff member, Thomas Brewster.

And 2019 Darktrace and Autonomy: tracking down all the money and CEOs published in Dec. 2018 by Luca Kosev is nearl as good!

Worth reading. Enjoy!

Two new British startup cap. tables: Autonomy and Bicycle

I recently published an updated version of a database of capitalization tables of 600 (former) startups. I obtain the data most of the time from the IPO prospectus of the company (that is the document the company publishes when it is listed on a public stock exchange, and in general Nasdaq.

These documents are an amazing source of information of all the business components of the companies even if I focus only on the shareholding and funding history. They are sometimes a little frustrating though as they do not cover the full history of the company, but only 3 to 5 years in the past so it is not simple to get the founders’ data for example.
Some countries do however provide access to the full company data, often for a fee like in France. A few cantons in Switzerland (Basel, Zurich) and the United Kingdom provide it for free and this is just great.

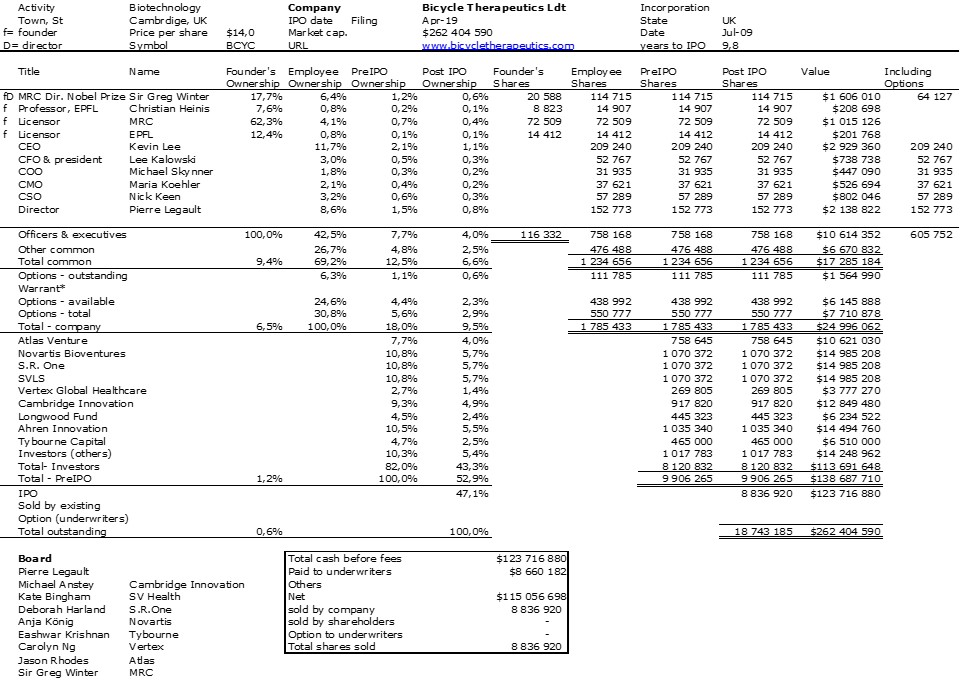
I have done some research for Revolut and Graphcore recently. Today, I revisited the data I had built for two British companies: Autonomy founded in 1996 and had gone public on Easdaq in 1998 and Bicycle Therapeutics, a biotech company with links to EPFL (Lausanne, Switzerland) founded in 2009 and public since July 2019.

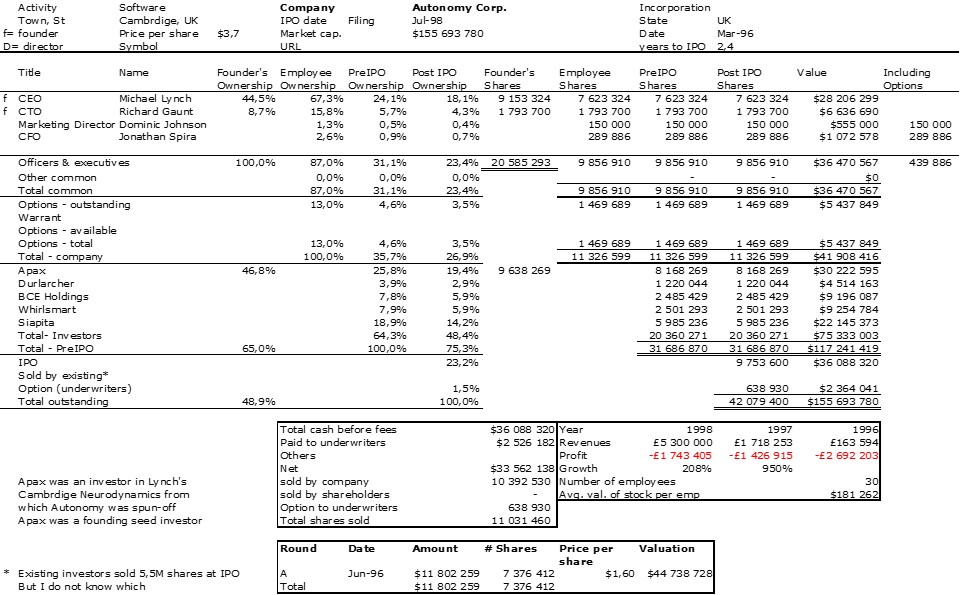
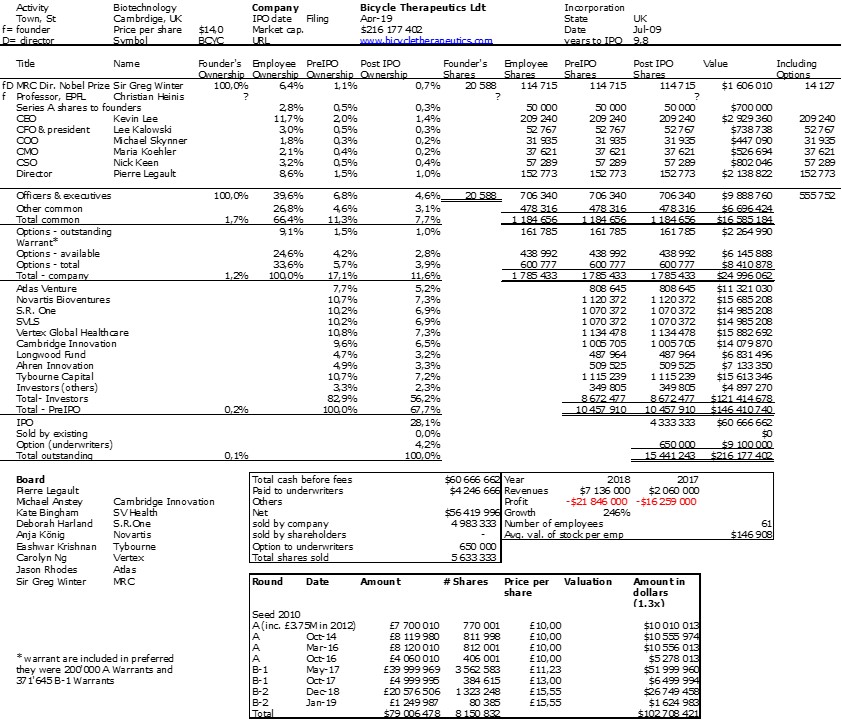
The IPO documents did not provide enough for me about the founders and early rounds. So here are my new tables:

Autonomy

Bicycle from the IPO data

Bicycle from the UK register data, the updated cap. table, the funding rounds and its growth over time:

The funding rounds


The growth of revenues and jobs

Data about equity of 600 startups – comments (7)

A final post (for now) about the data about 600 (former) startups. So what have they become today in April 2020?

First a quick point of caution: I counted some companies twice, because I had looked at their equity strutcure at different points in time: Alibaba had two IPOs in 2007 in HK and 2014 in the USA, Esperion had 2 filings in 2000 and 2013. This is not a big deal, except if you count Alibaba’s value twice!

So out of the about 600 former startups, I found that
– 20 were still private (they may have recently filed for IPOs though)
– 12 were private again after an IPO
– 13 had stopped their activity (often through bankruptcy)
– 225 had been acquired or merged with another company (Merger and acquisitions – M&As)
– 331 were still public.

So let us have a closer look at M&As and public companies:
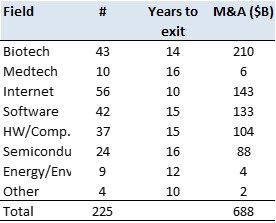
On the M&A side, the main acquisition value comes from biotech, with a $5B average value whereas software or internet is a little les below $3B.
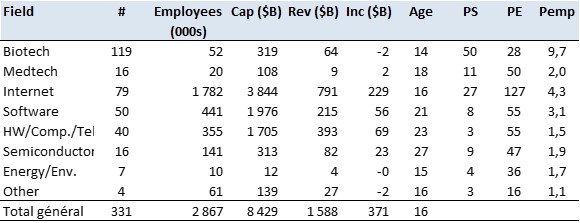
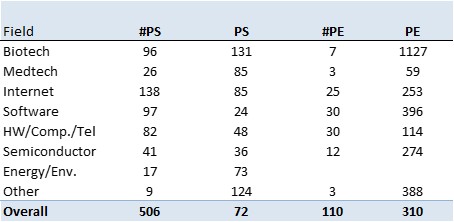
On the public side, I will let you discover depending on your interest about, given the field, the number of companies, employees, cumulative market capitalizations, sales, profits, then age of companies and current average price to sales (PS), price to earnings (PE) and an interesting personal metrics, price ot employees in $M (Pemp).

Graphcore shareholding is really strange!

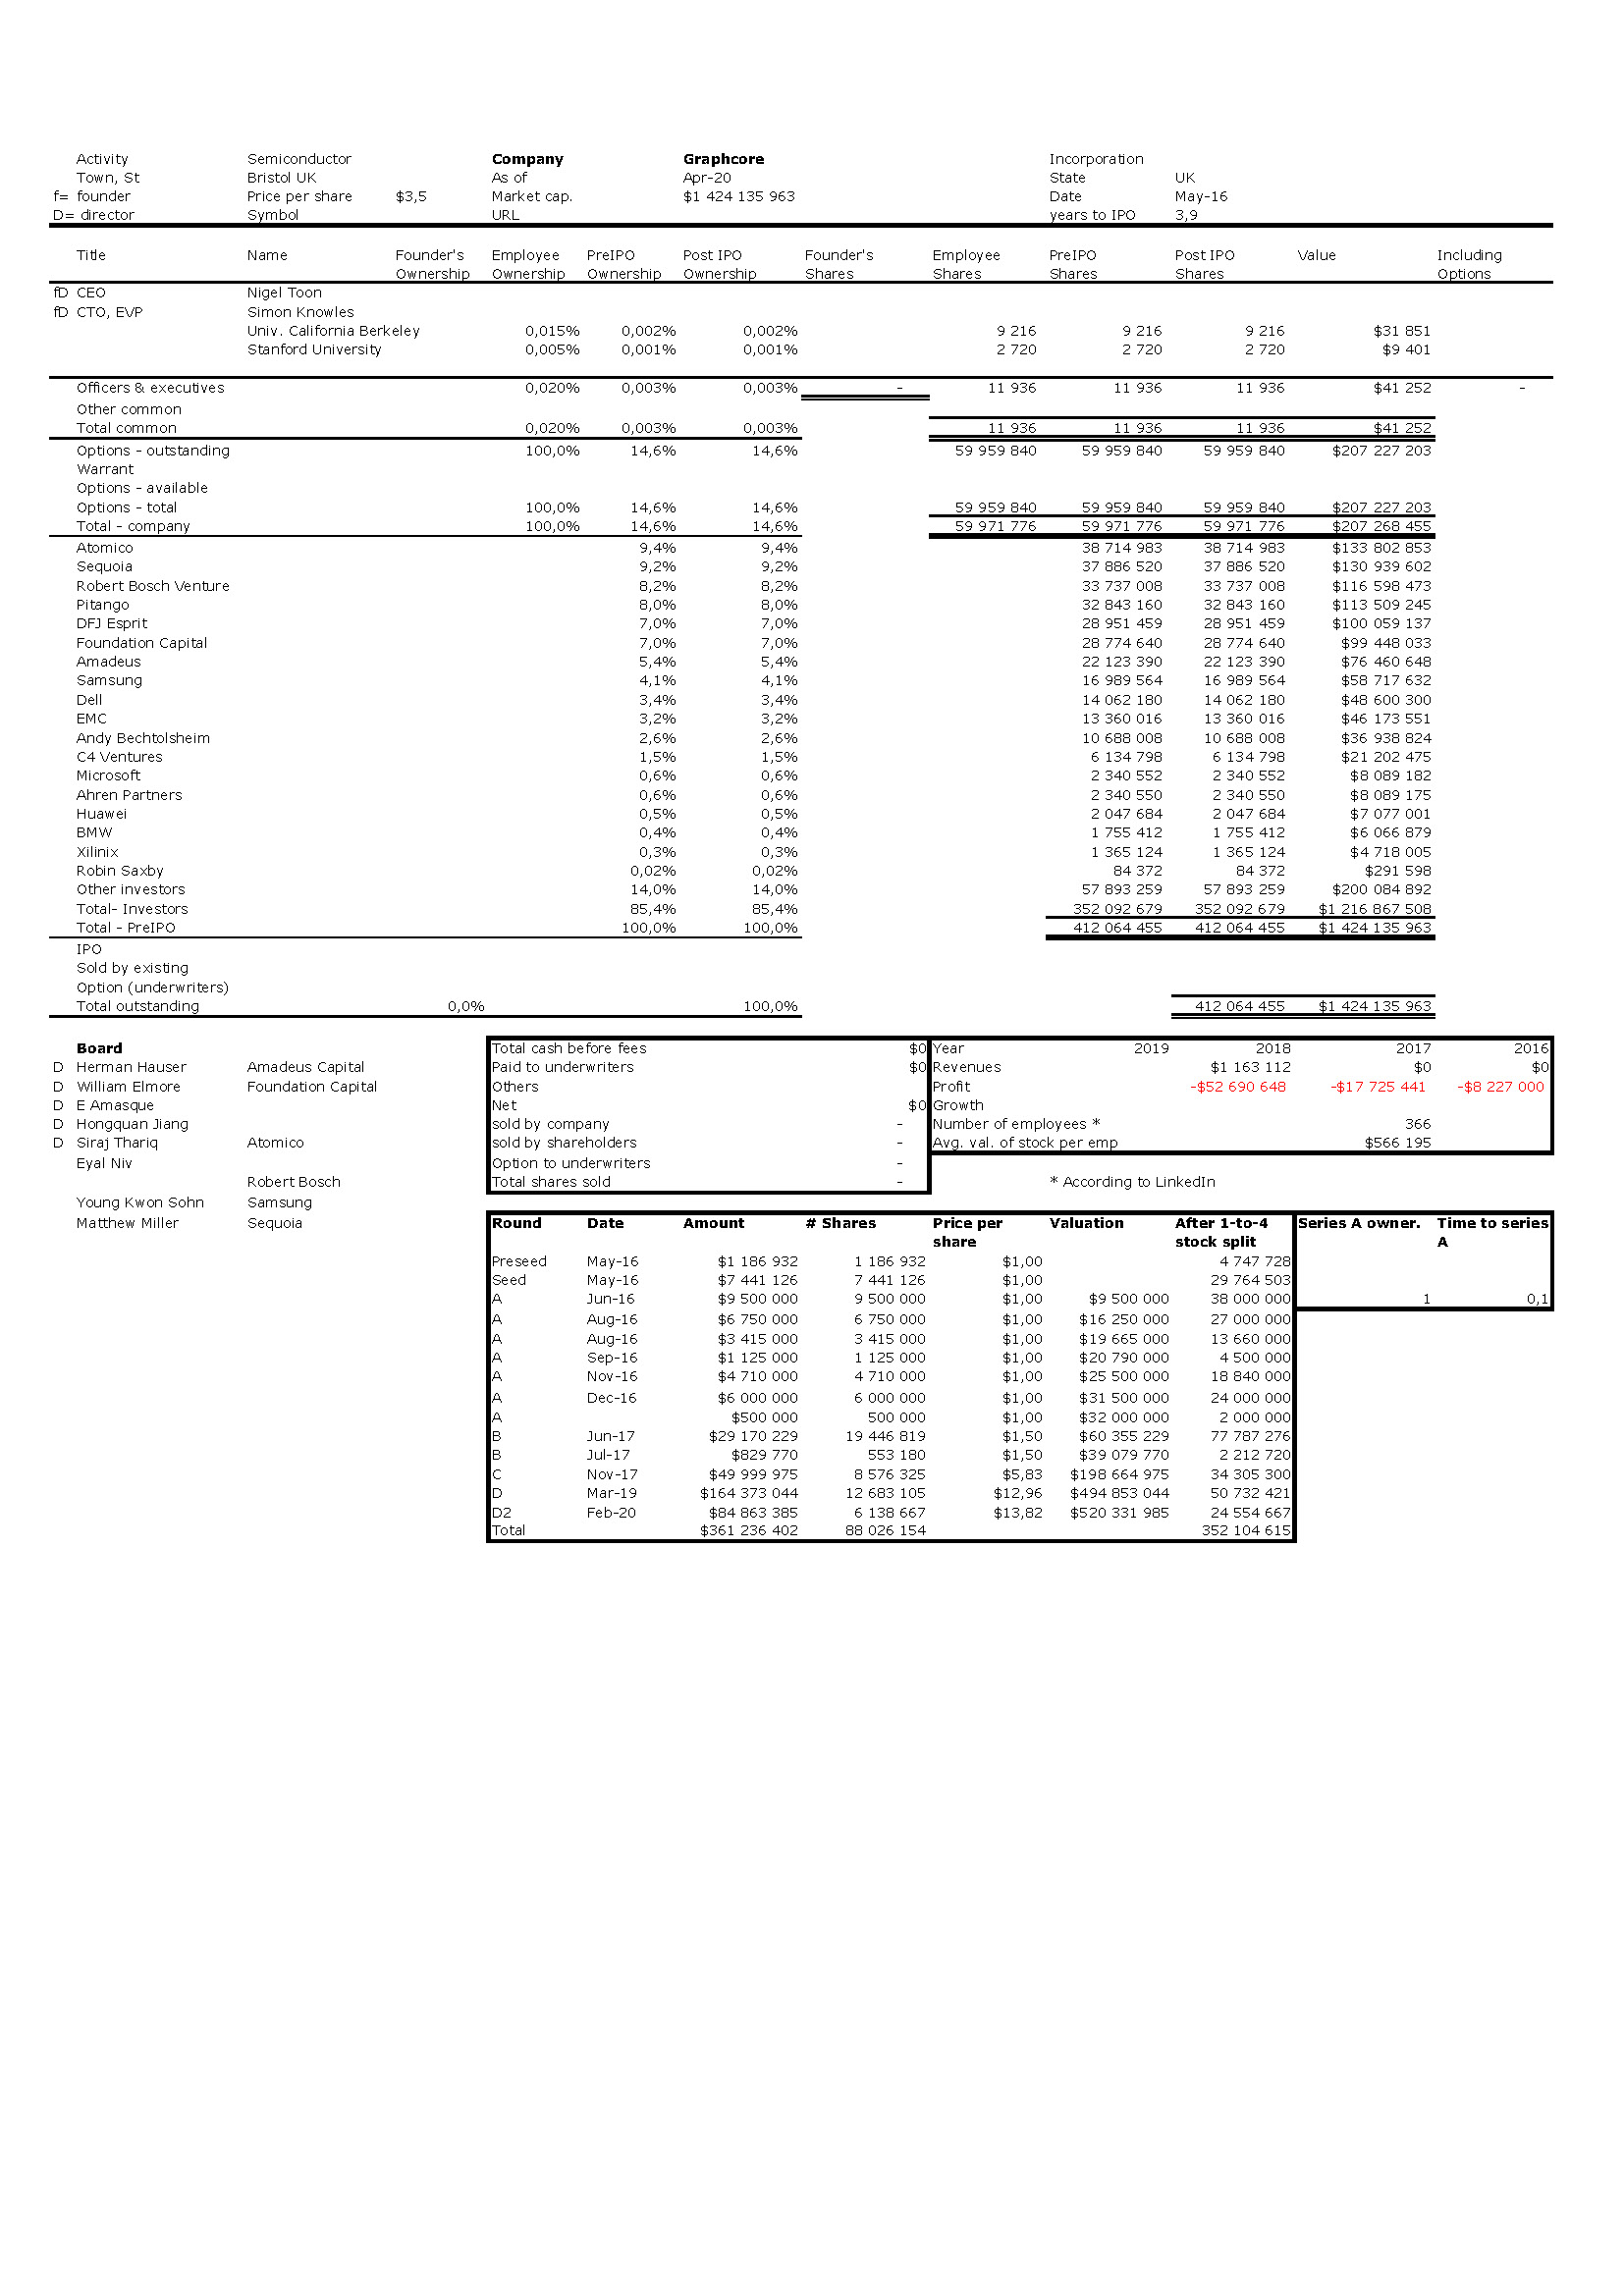
Graphcore gave me concerns. How is it possible that the two founders, Simon Knowles (58) and Nigel Toon (56), two serial entrepreneurs, who founded Icera Semiconductor in the past (sold to Nvidia in 2011 for $435 million or $367 million depending the sources – after having raised $258 million) and Element14 (a 1999 spin-off of Acorn – or its new name – sold to Broadcom in 2000 for $640 million), each owns only 4 shares of the startup? Are they so rich that they don’t need more? !!

All this follows my recent discovery that the UK gave open access to all company and in particular startup data. I began with Revolut a few days ago and now Graphcore. There had to be something wrong. The startup could not have only investors as shareholders. And then of course, I had forgotten the ESOP, the employee stock-options. So my only explanation is that the founders are part of this too and have a minimal number of shares. Still intriguing!

Data about equity of 600 startups – comments (6)

Sixth post of comments on the 600 startup data. Today, it’s about the valuation of startups.

I had touched the topic on page 615 of the pdf. Here is the data again.

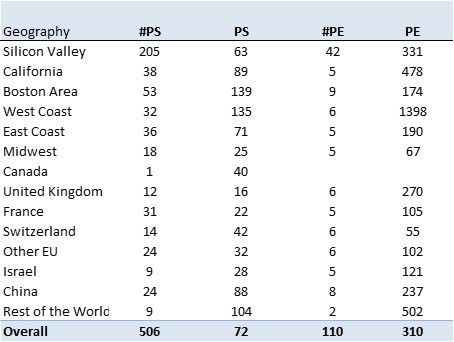
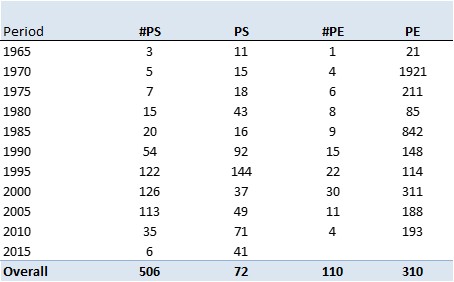
Be aware that these numbers are not typical of traditionnal companies. They show that startups going public are of a speculative nature, with a promise of very high-growth in the future. The multiples are very high and in the case of earnings, in fact most startups do not make a profit at IPO – about one out five!

Interestingly Silicon Valley does not have the highest multiples, but Europe is behing the USA.

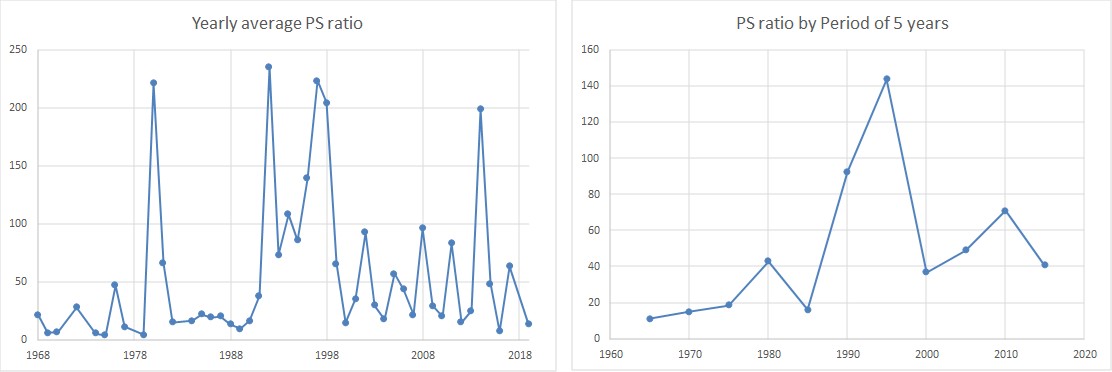
The tables give the PS ratio (price to sales – ratio between valuation and sales) and PE ratio (price to earnings – ratio between valuation and profits) and the number of startups taken into account each time. The following curves show the PS values by 5-year periods and by year.

If you are lost, here are slides I have used in the past and if you want to get the excel file, send me an email.

Revolut Shareholding

A colleague of mine (thanks Agnès!) informed me that the United Kingdom made public its data about startups. This is just amazing!

So I checked about Revolut and found all the data I could dream of. Founders, rounds of funding, shareholders.

Two young founders from Eastern Europe origin, 29 and 30-year old at the time of founding.

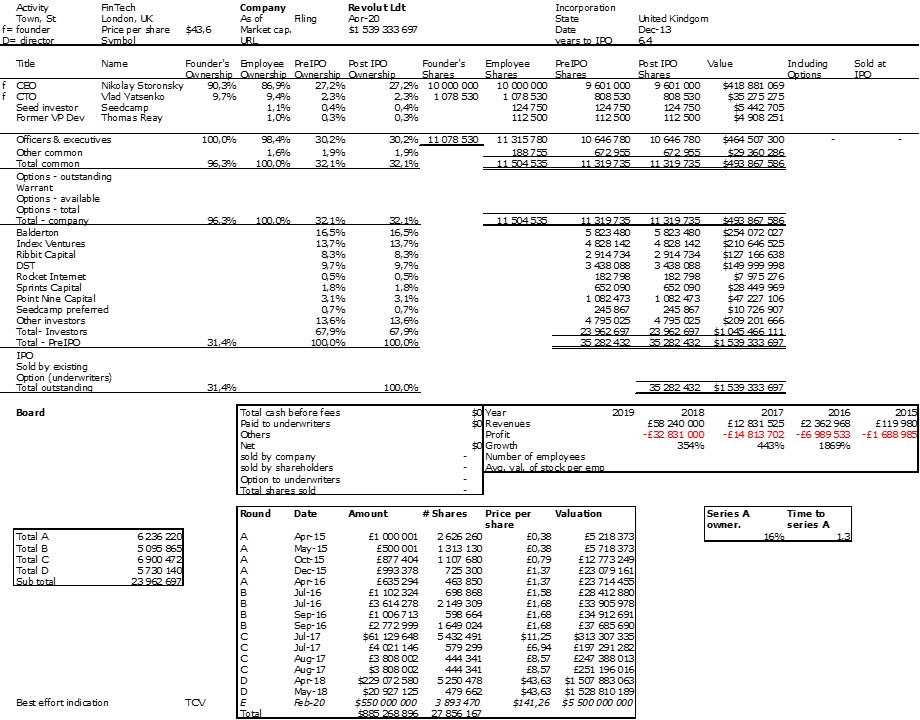
Some big, somewhat strange, rounds and here is today’s cap table. However series E is a best guest whereas previous rounds were publicly availale.

Comments welcome!

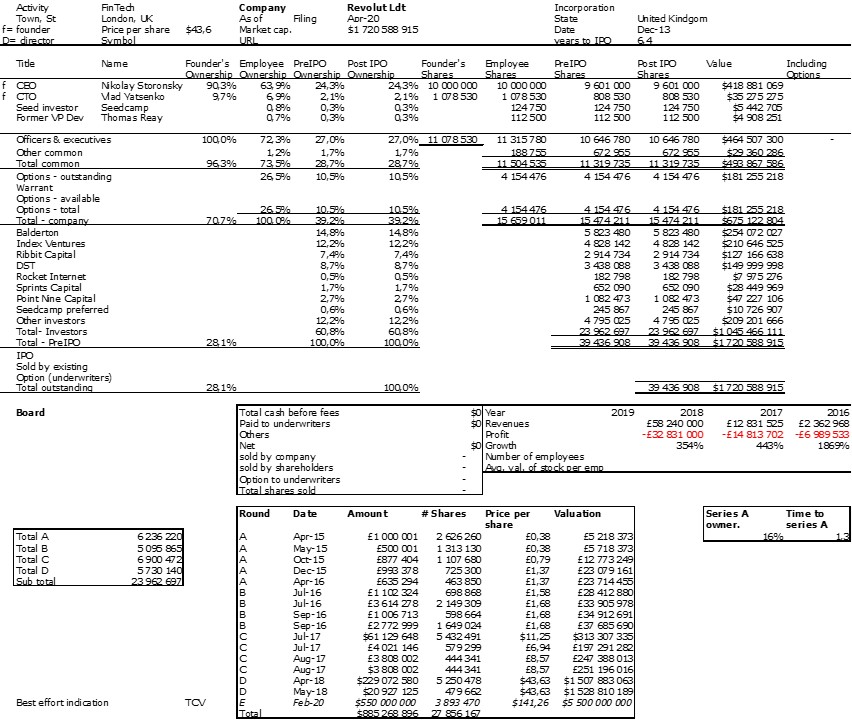
This morning (April 13), I discovered an important inaccuracy, nothing wrong but still: what about the ESOP, the stock-options. They are mentioned in the company documents, so here is a modified cap. table, and see the difference! I must add this is the ESOP in Dec. 2018, so the number is probably bigger today.

Data about equity of 600 startups – comments (5)

Fifth post of comments on the 600 startup data. Today, it’s about the ownership of non-founding CEOs (compared to the founders).

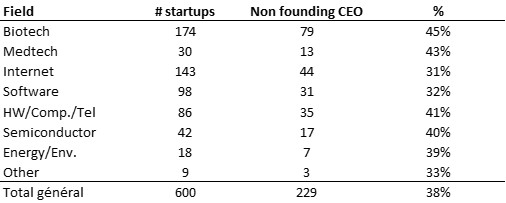
I noticed a few months ago that in a majority of cases, the CEO was a founder. This was a surprise. The data confirms this: there are a total of 229 startups with a non-founding CEO out of 600 (38%). Again, fewer in the digital domain, and more in the health-related fields.

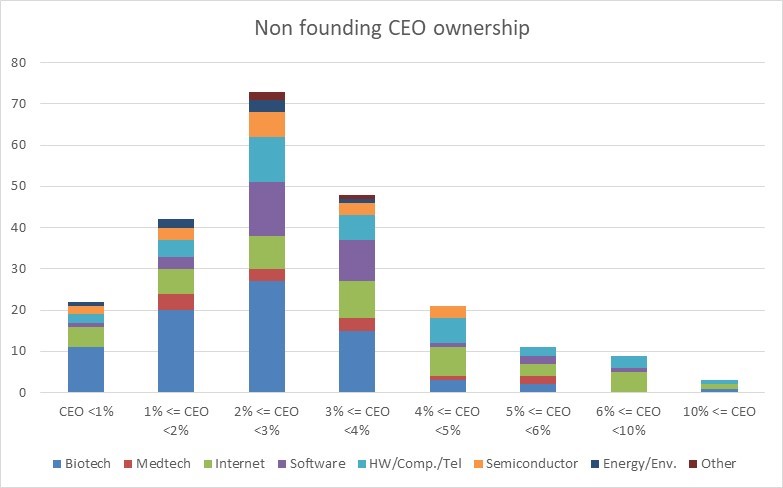
As you may see in my initial post, these CEOS have on average a 3% ownership (median value is 2.7%).

Is all this useful in practice? The median value of the ratio between the CEO & founders’s ownership is 0,5 (the average value is 1 because there are big outliers). Does this mean that if founders want to hire a CEO at foundation, he should have about 33% of the company, and at series A about 15% if you have read all my posts before!

Here is a more granular illustration.

The next image shows the founders’ ownership on the horizontal axis vs. the CEO’s on the vertical axis (with a zoom on the right).

A final illustration as food for thought, the founders’ ownership in the digital and health-related fields, relatively to the presence of a non-founding CEO or not. (Note that the vertical axis does not have the same scale for the two domains).

Data about equity of 600 startups – comments (4)

Fourth post of comments on the 600 startup data. Today, it’s about how equity is shared following my post yesterday which focused on founders’ equity.

A quick extract from the data gives the following average and median values:

So as a simple model, it is 10% for (2-3) founders, 20% for employees, 50% for private investors (VCs and BAs – business angels) and about 20% for public investors at IPO.

In addition the 20% for employees are made of 8% of common shares, 7% of granted options and 5% of available options.

Finally non-founding CEOs have 3%, VPs 0.8% and CFOs 0.6%.

Independant board members have as a group 0.4%, they are in general 2 to 3, so it is about 0.2% per director.

If you want to dig in the topic, you may be interested in the following slides:

Data about equity of 600 startups – comments (3)

Third post of comments on the 600 startup data. As I am not sure how many posts I will write about this, I created a tag #600startups.

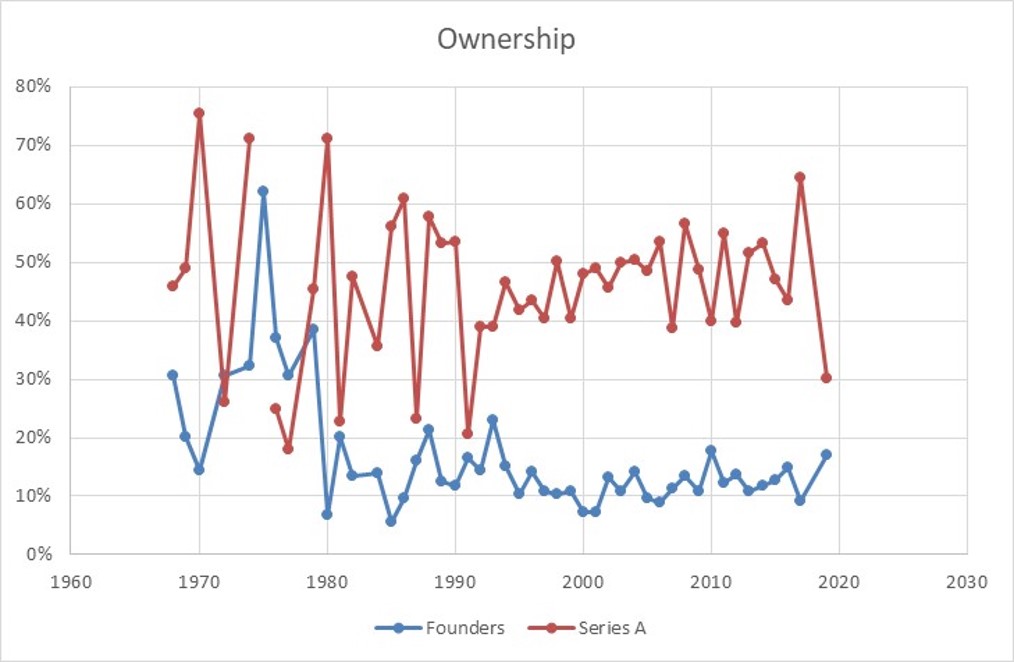
I looked at the founders’ age yesterday; today it is about their ownership over time. Founders keep 12.5% of the company at IPO, a little more in IT (about 16%), less in health (7-8%). The median value is 8.5%.

The series A curve is misleading! Founders’ ownership is at IPO but the Series A ownership is at the time of the round itself, not at the time of the IPO…

Moreover, I built a simple model which is the following: the Series A ownerhsip is based on the ratio between their shares and the sum of these shares and the founders shares increased by 20% (this to take into account future hires): as a short illustration, if Series A took 40% in the first round, founders had 50% as 10% was reserved for future hires (i. e. 20% of the founders’ stake).

It’s also worth noticing the series A are pretty big, about $9M on average (median value is $4.5M), and possibly in several tranches (as it is quite common in biotech).