
I should thank a colleague of mine for mentioning the surprising not to say crazy IPO of Coreweave. A new cap. table in my list which has now 948 companies. I will update my stats in the final pages of the pdf (available at the end of the post) when I reach 1’000 companies except I have been struggling with IPOs in the recent years. I will expand on this after the Coreweave case.
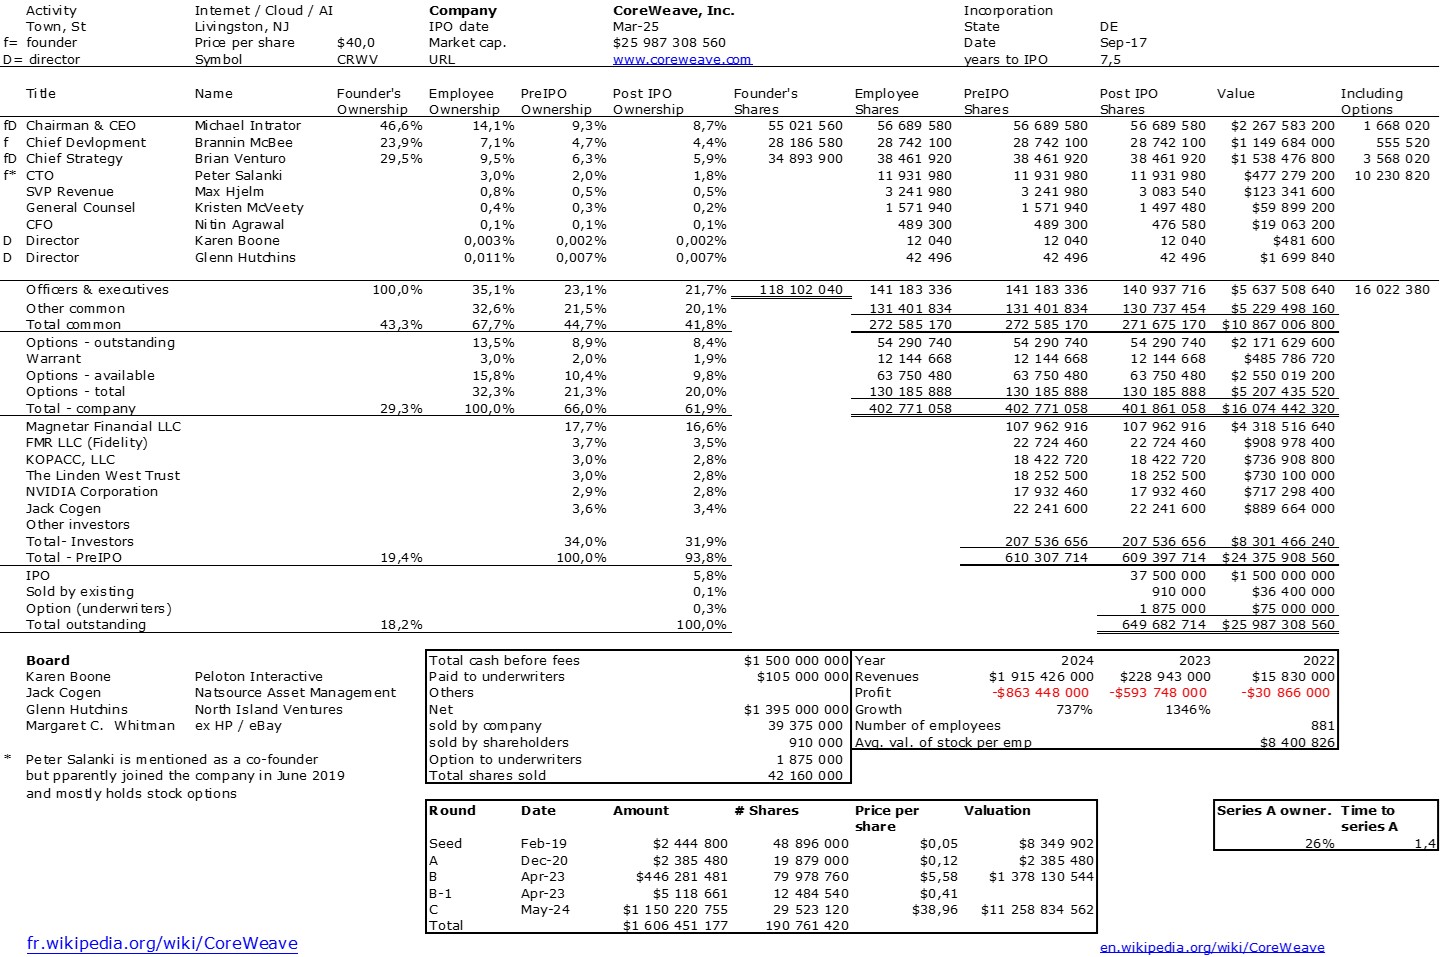
It’s really a strange story that I did not know and discovered on Wikipedia. 3 founders who were commodity traders launched a crypto currency mining company with obviously a data center and tons of GPUs. They pivoted in 2019 to providing cloud computing in a very aggressive manner. There is a 4th cofounder, the CTO but he apparently joined with the pivot (and mostly own stock options). A crazy growth in revenues (and losses) as the quaterly results show in the next table. Apparently there is cautiousness becuase Microsoft represents 60% of the revenues and the debt is alos about $800M. Impressibe but maybe fragile…

Now the IPOs !
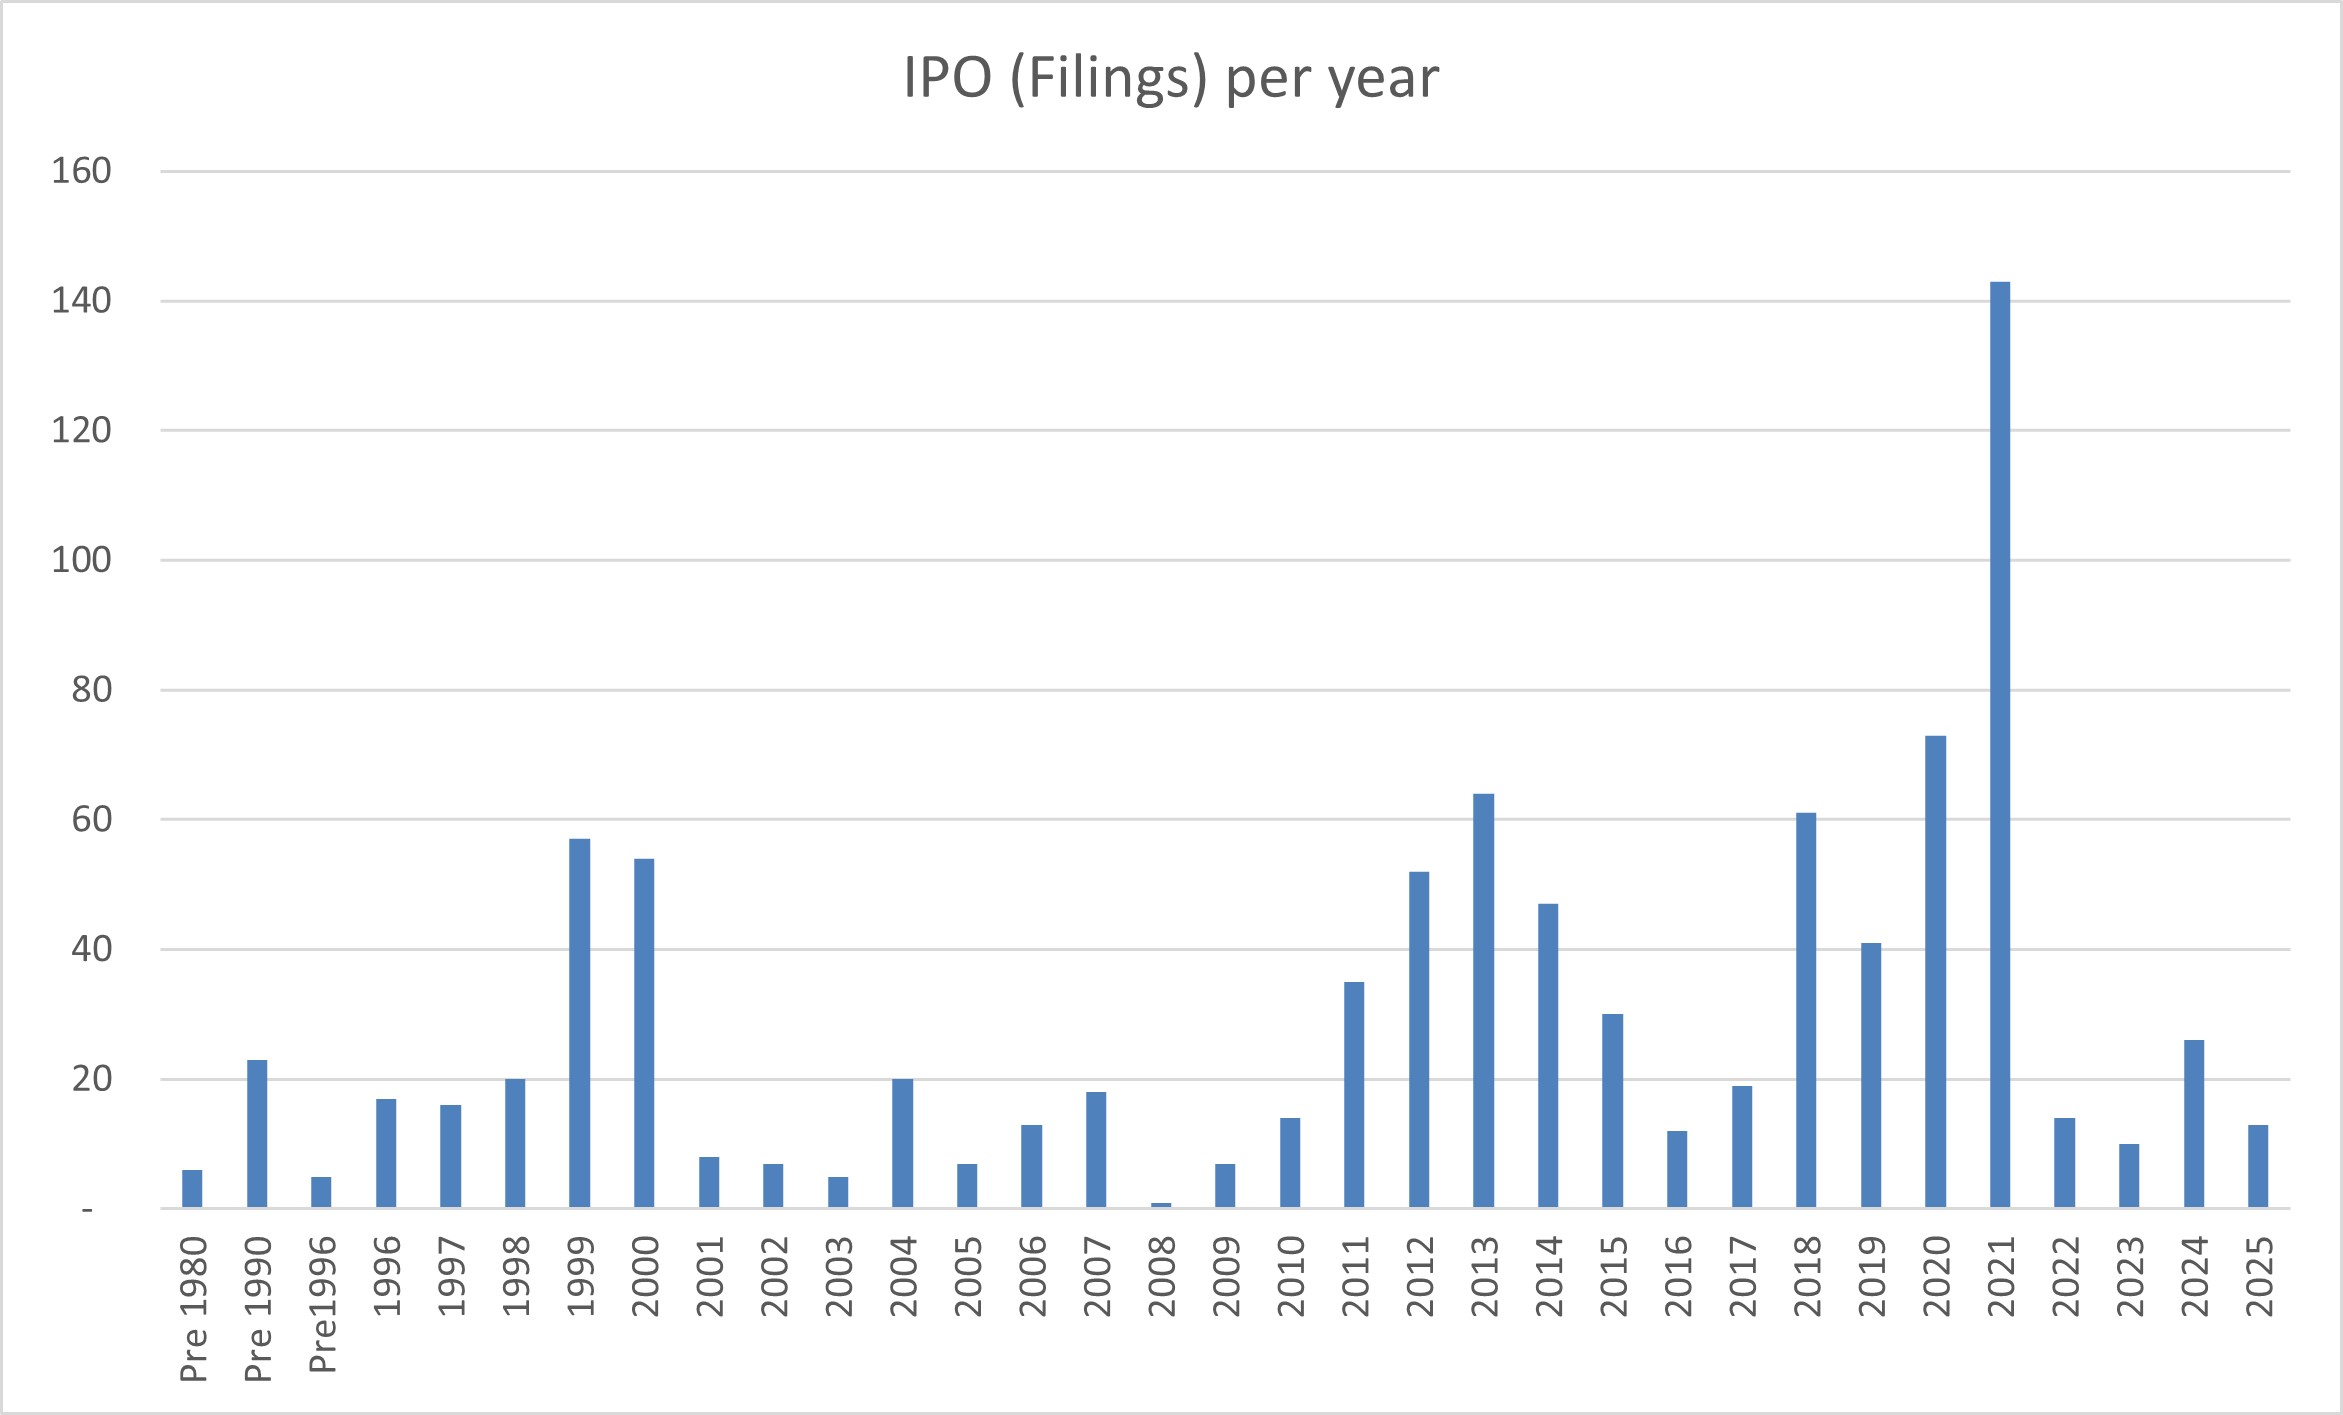
The figure above represents the number of companies in my pdf by year of exit (mostly IPO filings, and much more rarely M&As). [Of course I do not have all IPOs and I found a document which shows I have 27% and 87% of the IPOs of years 2011-22.]
I had forgotten there was such a bubble and crash in 2021 so I had a look at VC investments over decades which gives the following figure. But with so few IPOs, LPs will become more and more impatient putting pressure on VCs all the more money is not as cheap as before…
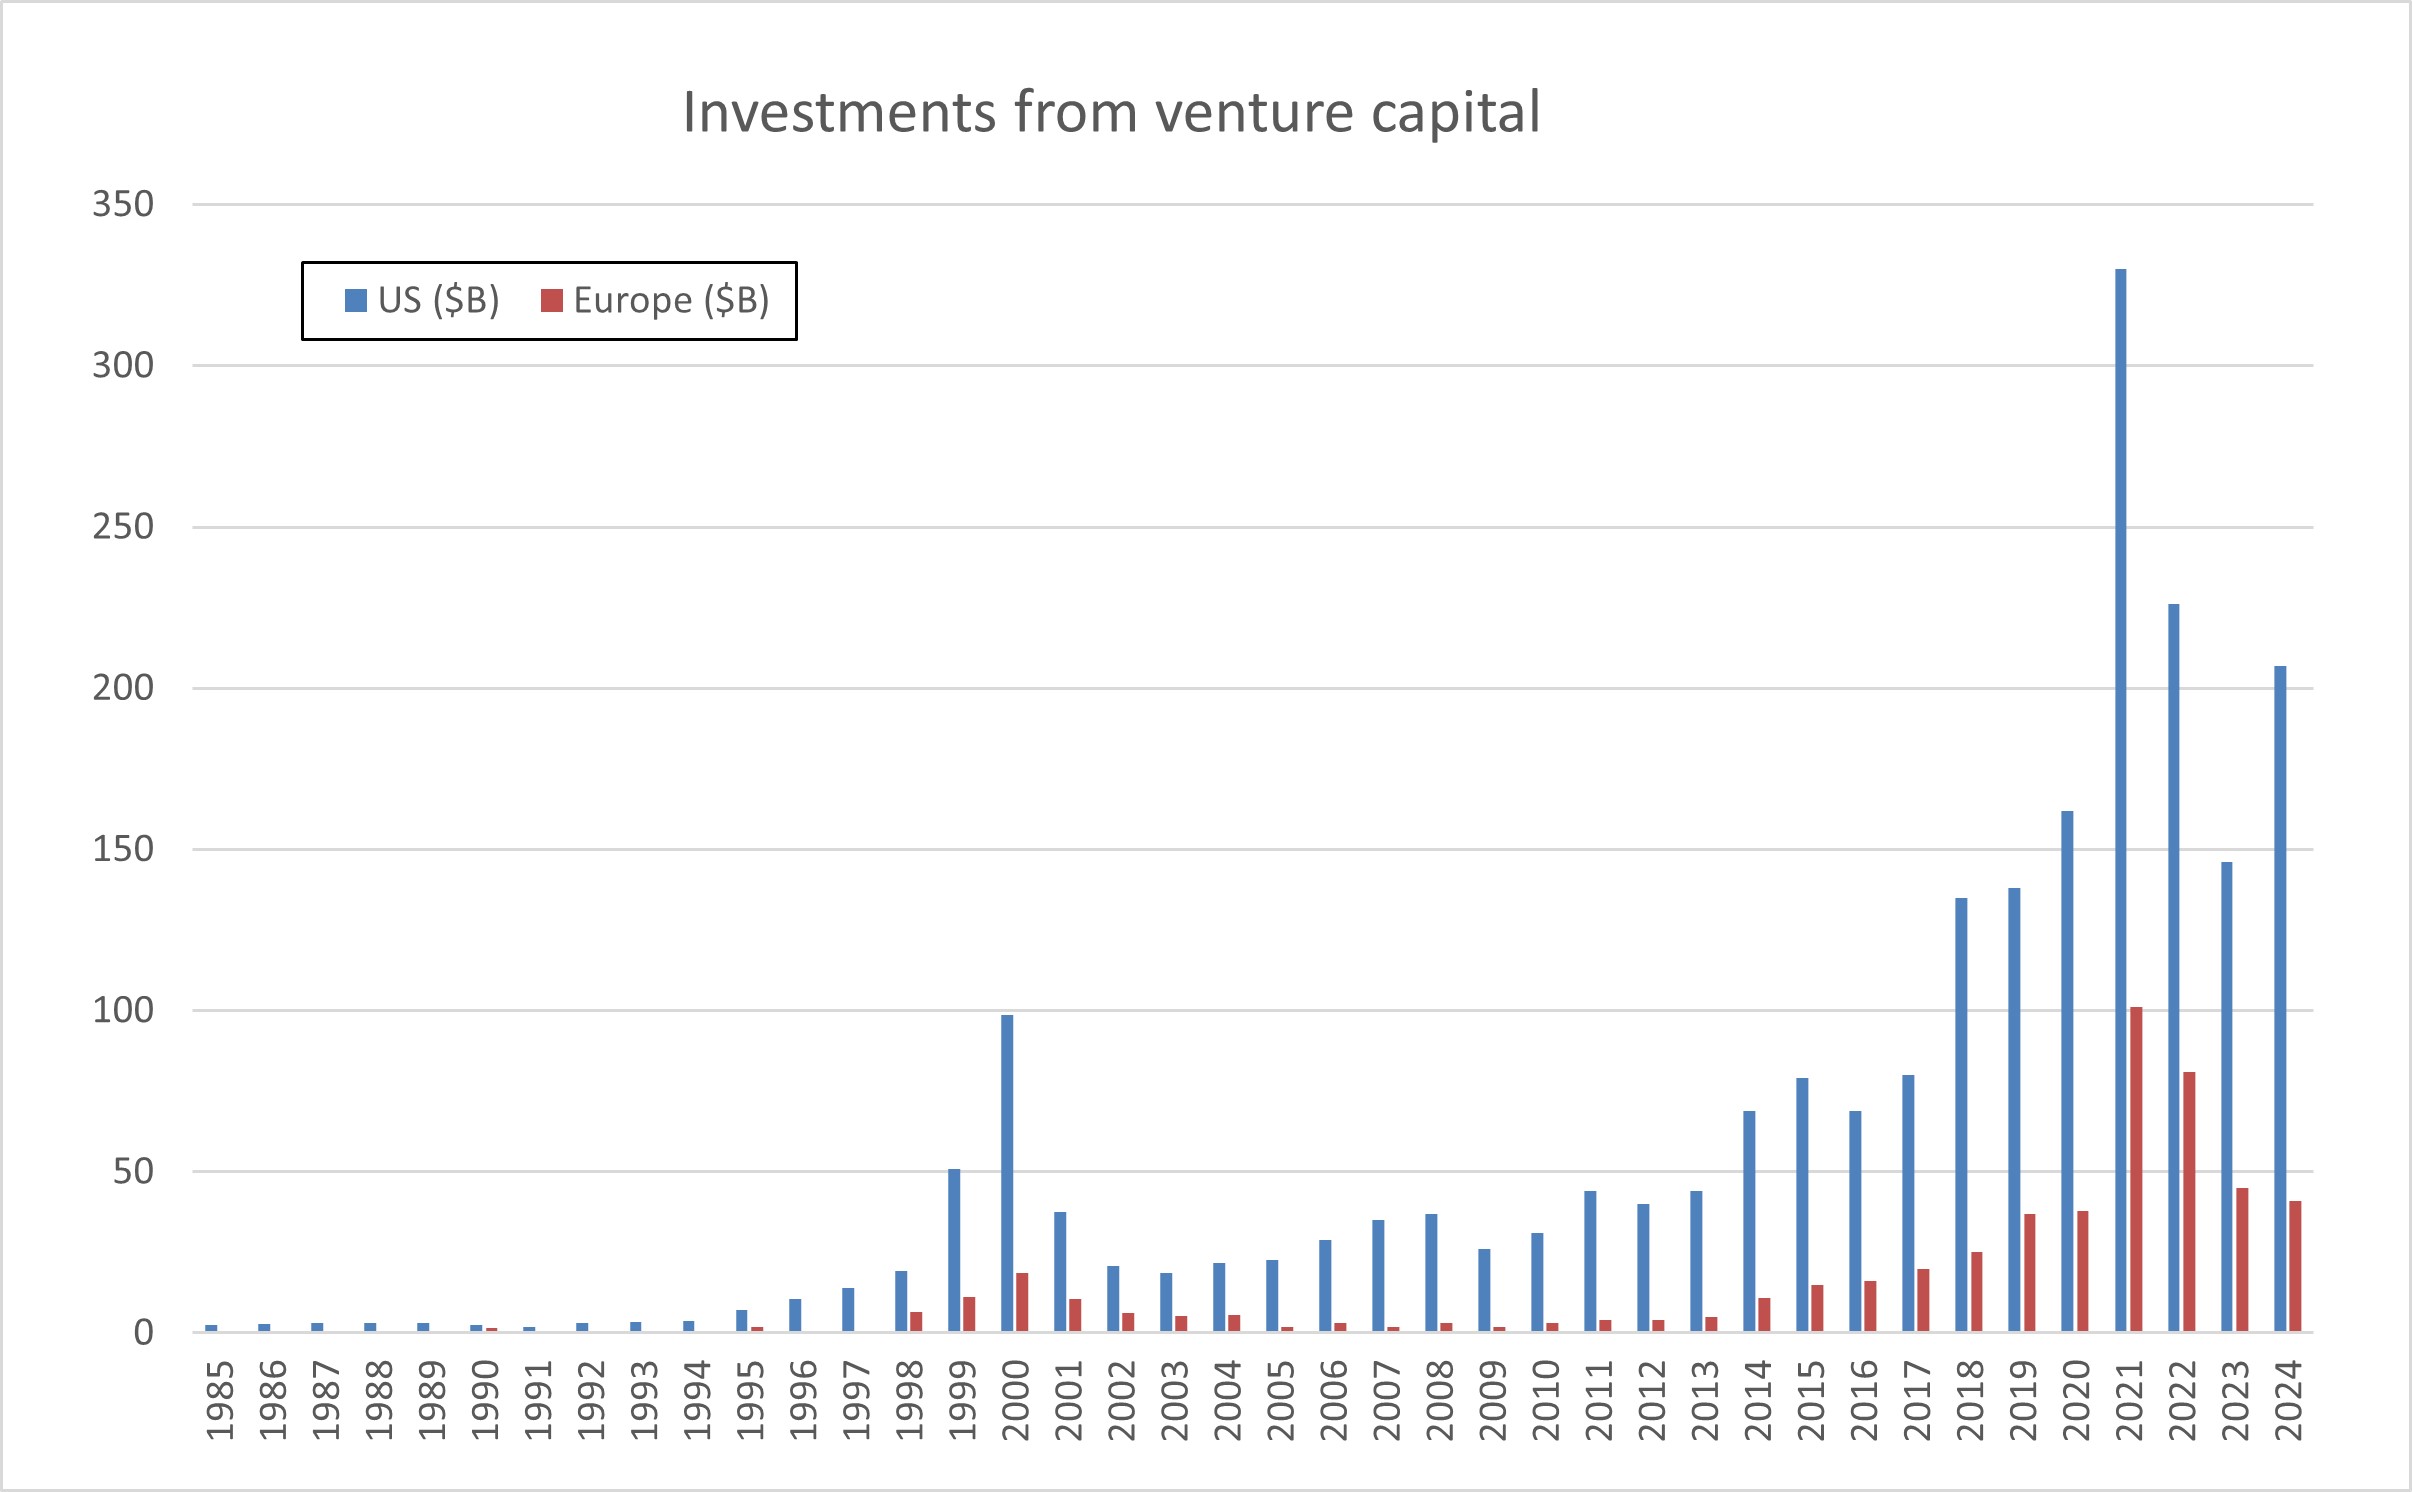
Now when I hear that VC is in a crisis and I look at the levels of investments in the 7 years compared to the previous decades, I cannot help btu think there is a lot of money available…
Finally the promised pdf, but at this rate it will take me another two years before I release new statistics : Equity in start-ups – Historical data from 900+ companies.