
The recently published The State of the European Tech, co-sponsored by Atomico and Slush is an extremley interesting analysis of the European tech start-up and VC scene. it is a rather long 118-slide document but most (not all) pages provide food for thought.
Here are a couple of comments, in the page order:
– The introduction is too optimistic (slides 5-7). I doubt their title: the future is being invented in Europe. But it has always been Atomico’s founder vision: see Europe and Start-ups : should we worry? Or is there hope? The future will tell us… One interesting point though: London, Berlin and Paris are the 3 hubs main European hubs and Paris was probably underestimated (in the past).
– The entrepreneurial mindset is continuously improving (slides 15-16). Repeat entrepreneurs are more numerous (slide 18). And they mention their importance not so much as future successful entrepreneurs (you may know my doubts – check Serial entrepreneurs: are they better?) but because of the experience and network they bring.
– I love slide 21 with EPFL #4 world wide in Computer Science (though I hate these rankings!). Switzerland is clearly on the map together with the UK. I am honestly less convinced about the impact of business schools in tech (slide 22). Talent exists in Europe but may not be available for tech (slide 23).
– Again the three top hubs are obvious: together London, Paris and Berlin outnumber Silicon Valley. But the ranking from #4 to #20 is mostly linked to city size, not so much any unique positioning. Tech is creating jobs faster than other industries (slide 26). Never too late! But again Europe is fragmented with 153 identified tech hubs (slide 34)
– Migrants (slides 27-29). Again the UK is #1. France and Germany follow. And Switzerland is well-ranked (except for non-Europeans).
– Local entrepreneurs want to stay home (slide 37): 60% prefer home to another place in Euope (17%) or Silicon Valley (12%), even if 25% of founders incorporated outside of their home country (slide 38). Clearly Europe exists! Even if slide 39 shows more local migrations inside Europe, with the exception of London and Berlin again and the links between hubs are weak (slide 41)
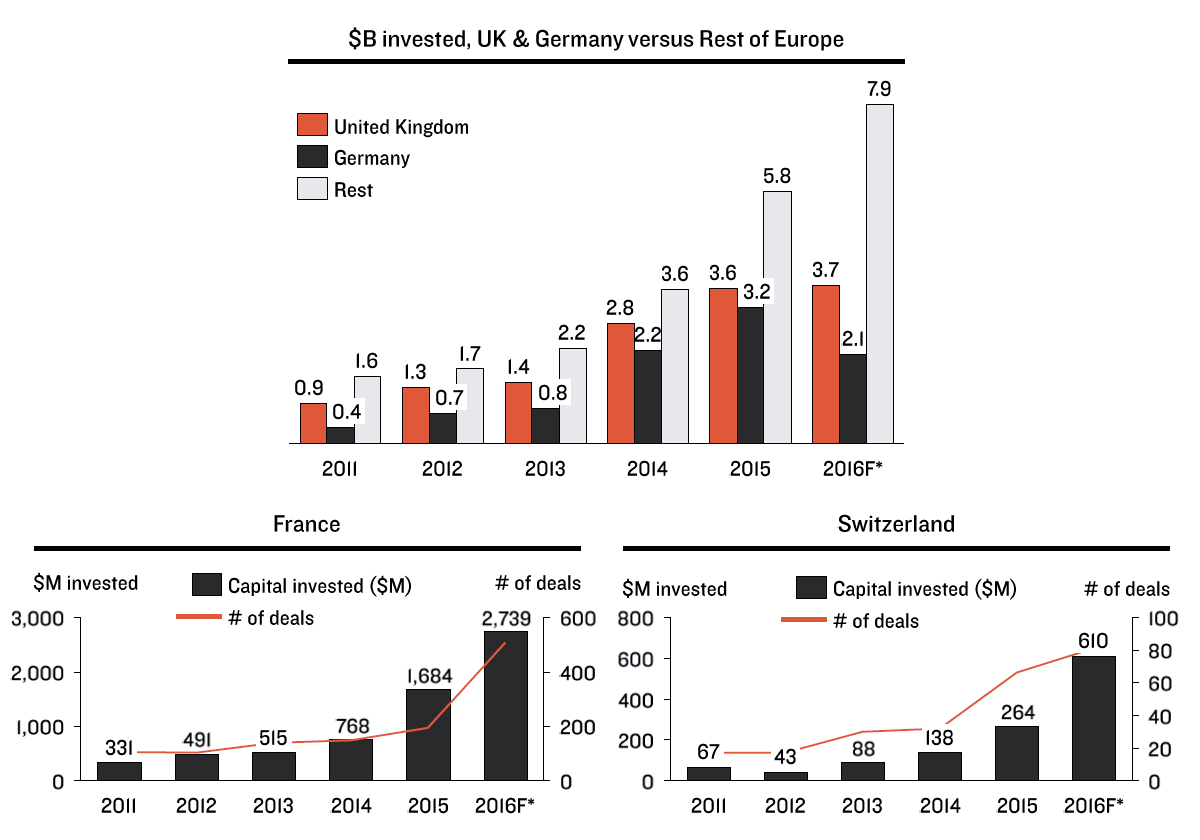
– The slides about venture capital are the most surprising. Slide 46 shows that the European investments have jumped from less than $5B before 2013 to $13B in 2015-16. (In comparison the US is about $30B). And the growth is consistent from early eseed ($0-2M) to early stage ($2-5M) and later stage ($10-50+M). I assemble here their data about the UK, Germany, France and Switzerland (slides 50-52). A new generation of investors is confirmed, those who were entrepreneurs 1st (slide 60). The early such actors were Atomico, Liautaud/Balderton, Niel/Kima. But many emerge. A new generation of funds also emerge (slide 64), and yes, US funds invest in Europe (slide 65)
– Their section about deep tech is less convincing (to me). Probably I did not fully understand what they meant by that and why it would be so special. Slides 78-9 about US tech giants coming to Europe and about their acquisitions in Europe is worth checking though.
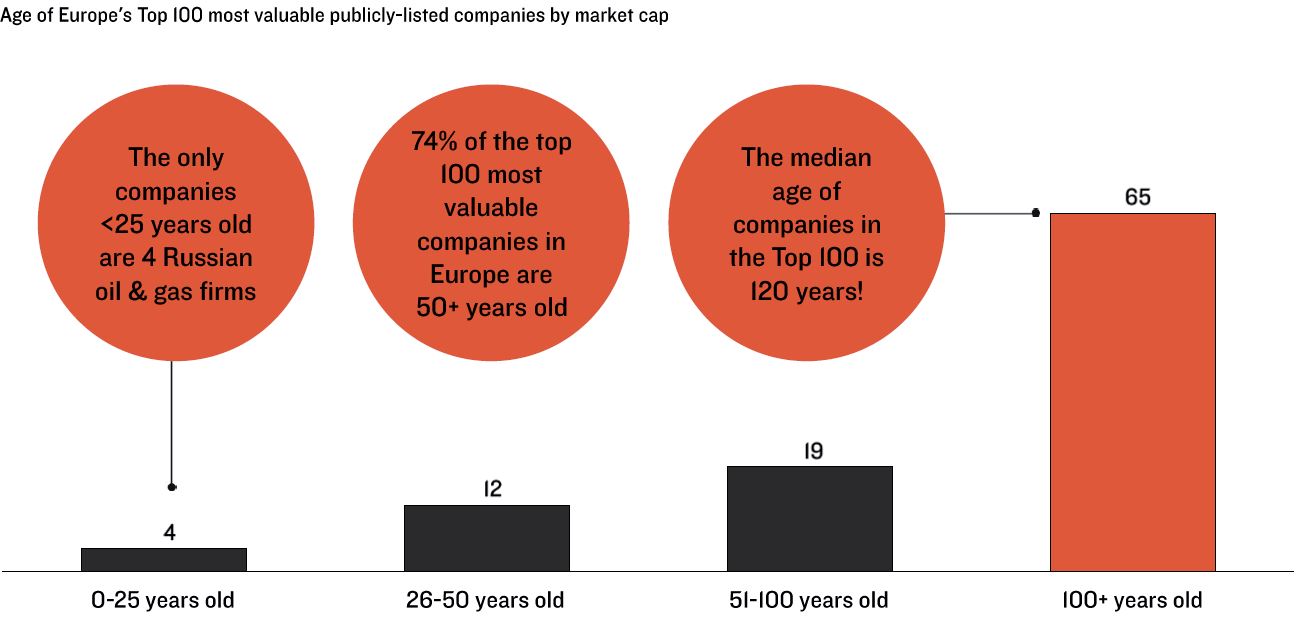
– I was not convinced either about the growing awareness of European corporations of the importance of tech. Their investments and acquisitions are still small compared to their US counterparts (slides 84-86). But slide 83 is the confirmation of a scary situation. This is another illustration of the Darwinian and Lamarckian innovation. Look at next figure.
– The section about scale-ups and exits (slides 89-101) could have been called unicorns & IPOs. I see bubbles and low value creations. Not good enough and not enough tech…
– Finally the lside about perceived risks is worth spending some time. they classify them as Business issues (40%); Economic issues (30%); European issues (22%); International issues (8%). But somehow their classification is subjective. For example if you combine risk aversion (4%), fear (2%), ambition (2%), that is 8%. And talent (4%), innovation (3%) and education (2%) would be another 9%. These elements which I consider as cultural could be considered as quite high…
All these notes were taken while reading so don’t see them as a deep analysis and you should build your own views about this really interesting analysis.