
A short follow-up to my yesterday’s post Research and Development (R&D) in Tech Startups (vs. Sales & Marketing) as I was not fully satisfied with and I am still not !
I could not draw any conclusion and worse the results were not easy to read. I am not sure this will be any better, but in addition to the mean and median values of R&D intensity (relative to Revenues or Sales & Marketing), I add here a few more figures illustrating the frequencies of these values.
First a reminder of the mean and median values per field
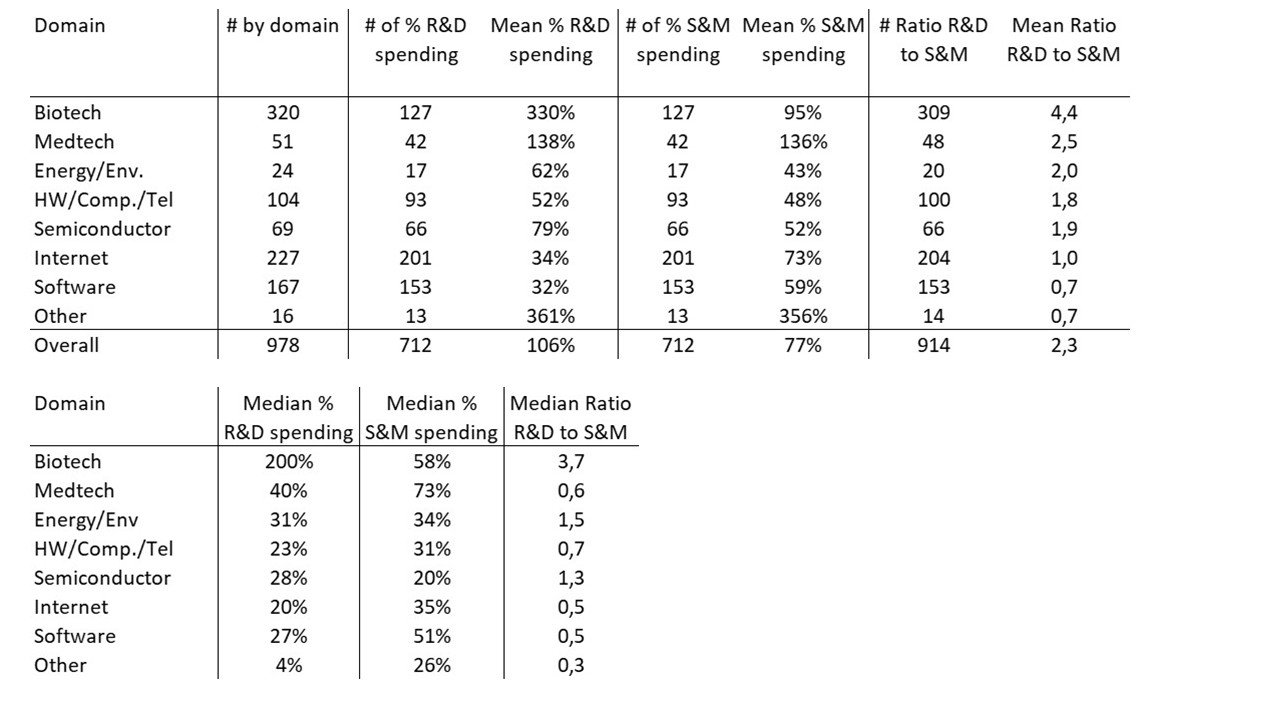
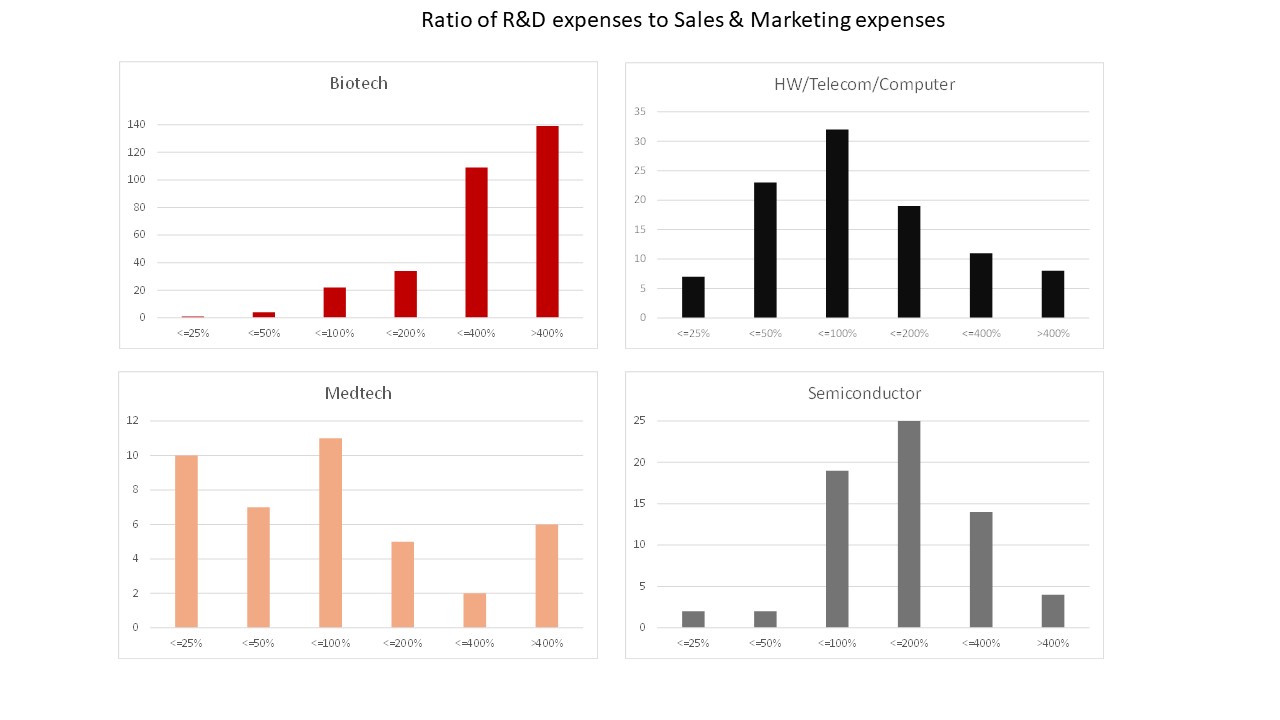
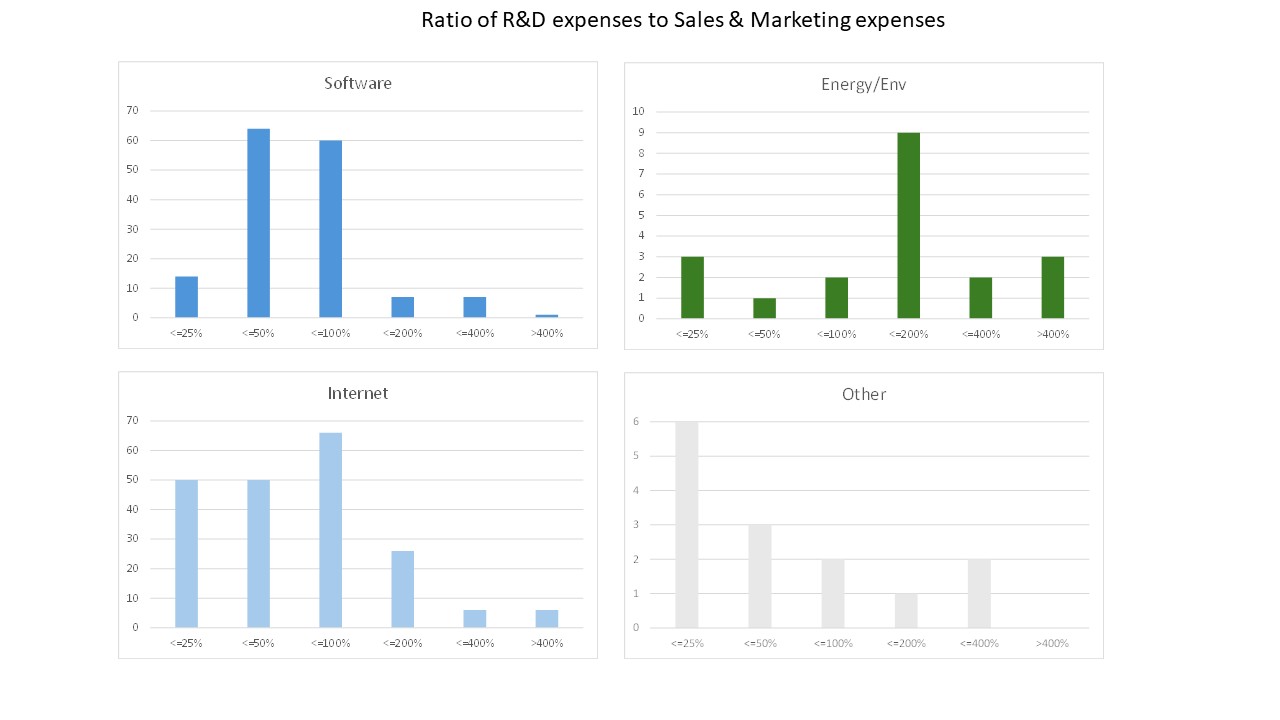
Second, the ratio of R&D (research & development) to S&M (sales & marketing) in the 8 different fields
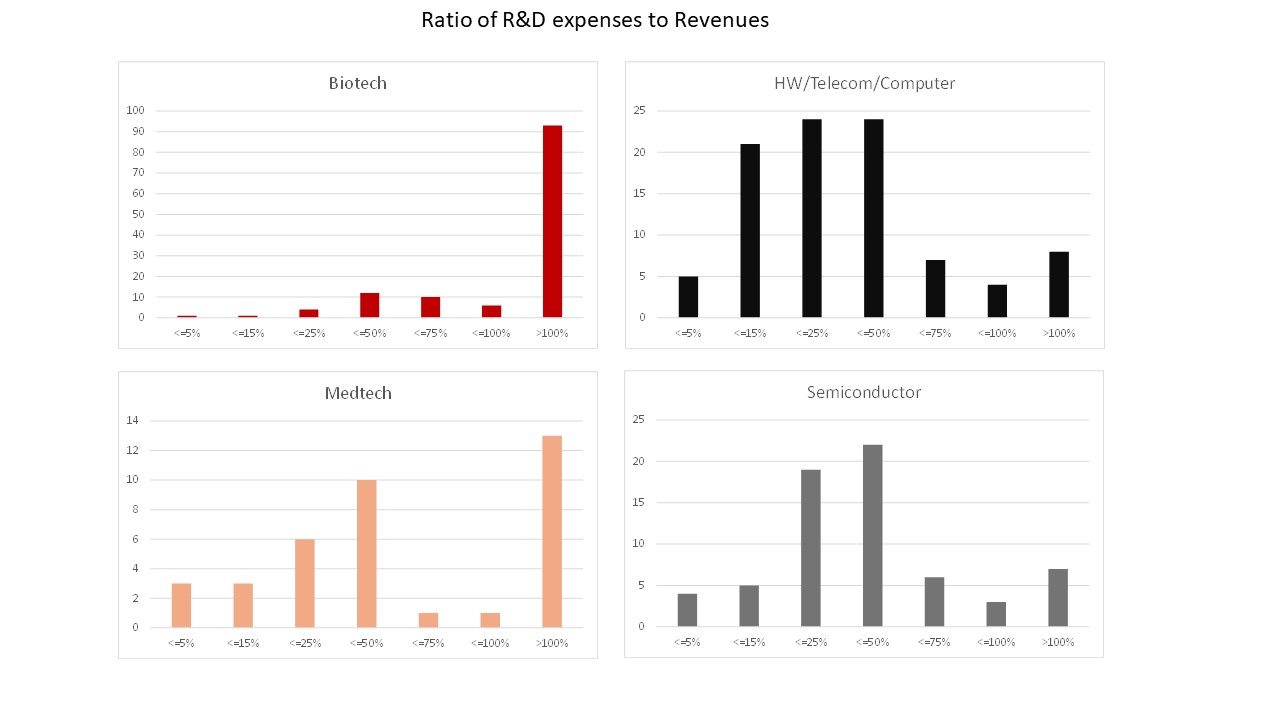
Third, the ratio of R&D (research & development) to revenues in the 8 different fields
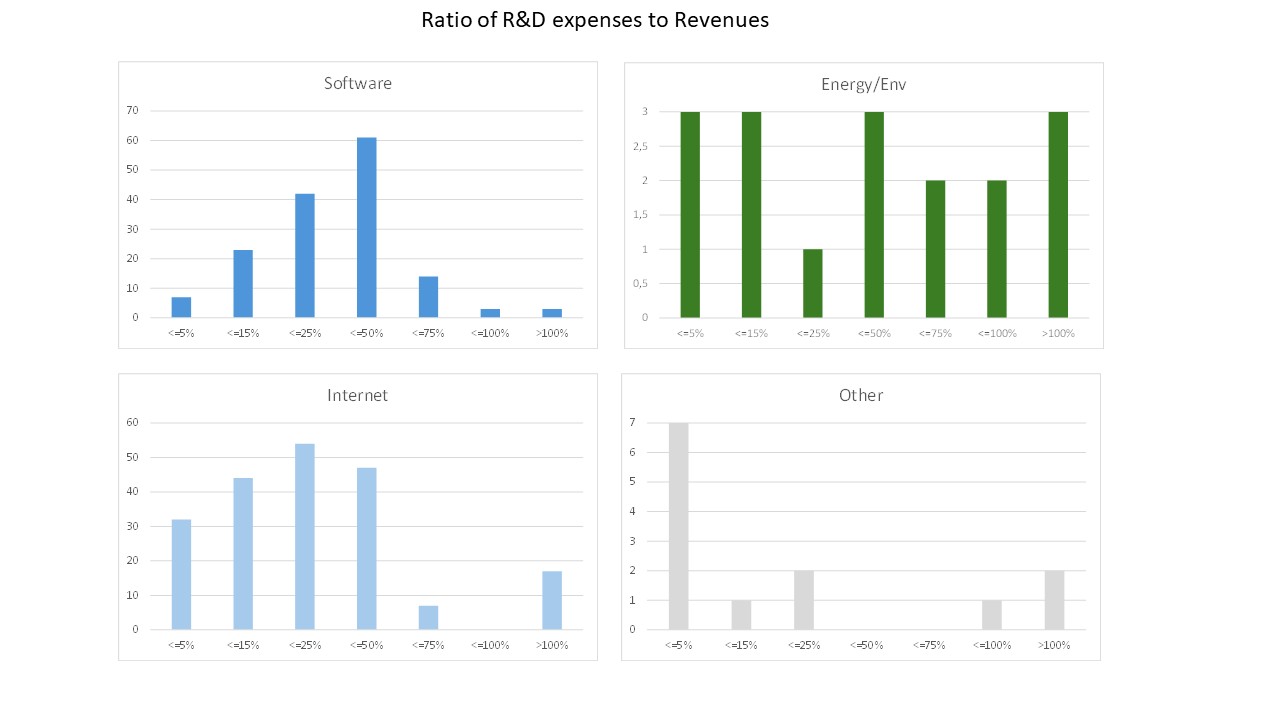
It’s clear, I think, how different software and the internet are in terms of R&D investment, but even so, nuance is still essential. I can only leave you to your own interpretation or conclusions.