This strange post was motivated by my colleague Antoine (thanks!) who asked me what I thought of a recent article which claimed that in startups, technology is not as important as many think. The article is in French Pourquoi, dans les startups, les moins techniques gagnent souvent and was written by Manu Papadacci-Stephanopoli.
So let me translate the claim : in startups, the least technical often win. Yes, it’s harsh. And yet, it’s true. We always imagine a startup as a perfect technological machine. Ahead of the curve. Code. R&D .The more complex it is, the better it must work. Except that reality is much harsher. A startup isn’t primarily a technology company. It’s a hypergrowth company. Technology is clearly an advantage. A booster. But it’s neither a sufficient condition, nor even essential.
I never really thought deeply about it, probably because I fully agree and learnt this during my VC years. Technology is important but it is far from sufficient. And selling is tough. Google was the best example that “First mover adavantage was a myth”. So I agree again with Manu Papadacci-Stephanopoli when he adds later “In its early days, Google didn’t have the best algorithm for linguistic analysis. Its competitors were more advanced. But Google exploited something else: metadata, hyperlinks, the famous “backlinks,” the collective intelligence of the web. Less spectacular. But simply more effective.” (À ses débuts, Google n’avait pas le meilleur algorithme sur le plan linguistique. Ses concurrents étaient plus avancés. Mais Google a exploité autre chose : les méta-données, les liens hypertexte, les fameux “back-link’, l’intelligence collective du web. Moins spectaculaire. Mais juste plus efficace).
So I had to go one step further, dig deeper and here is my analysis.
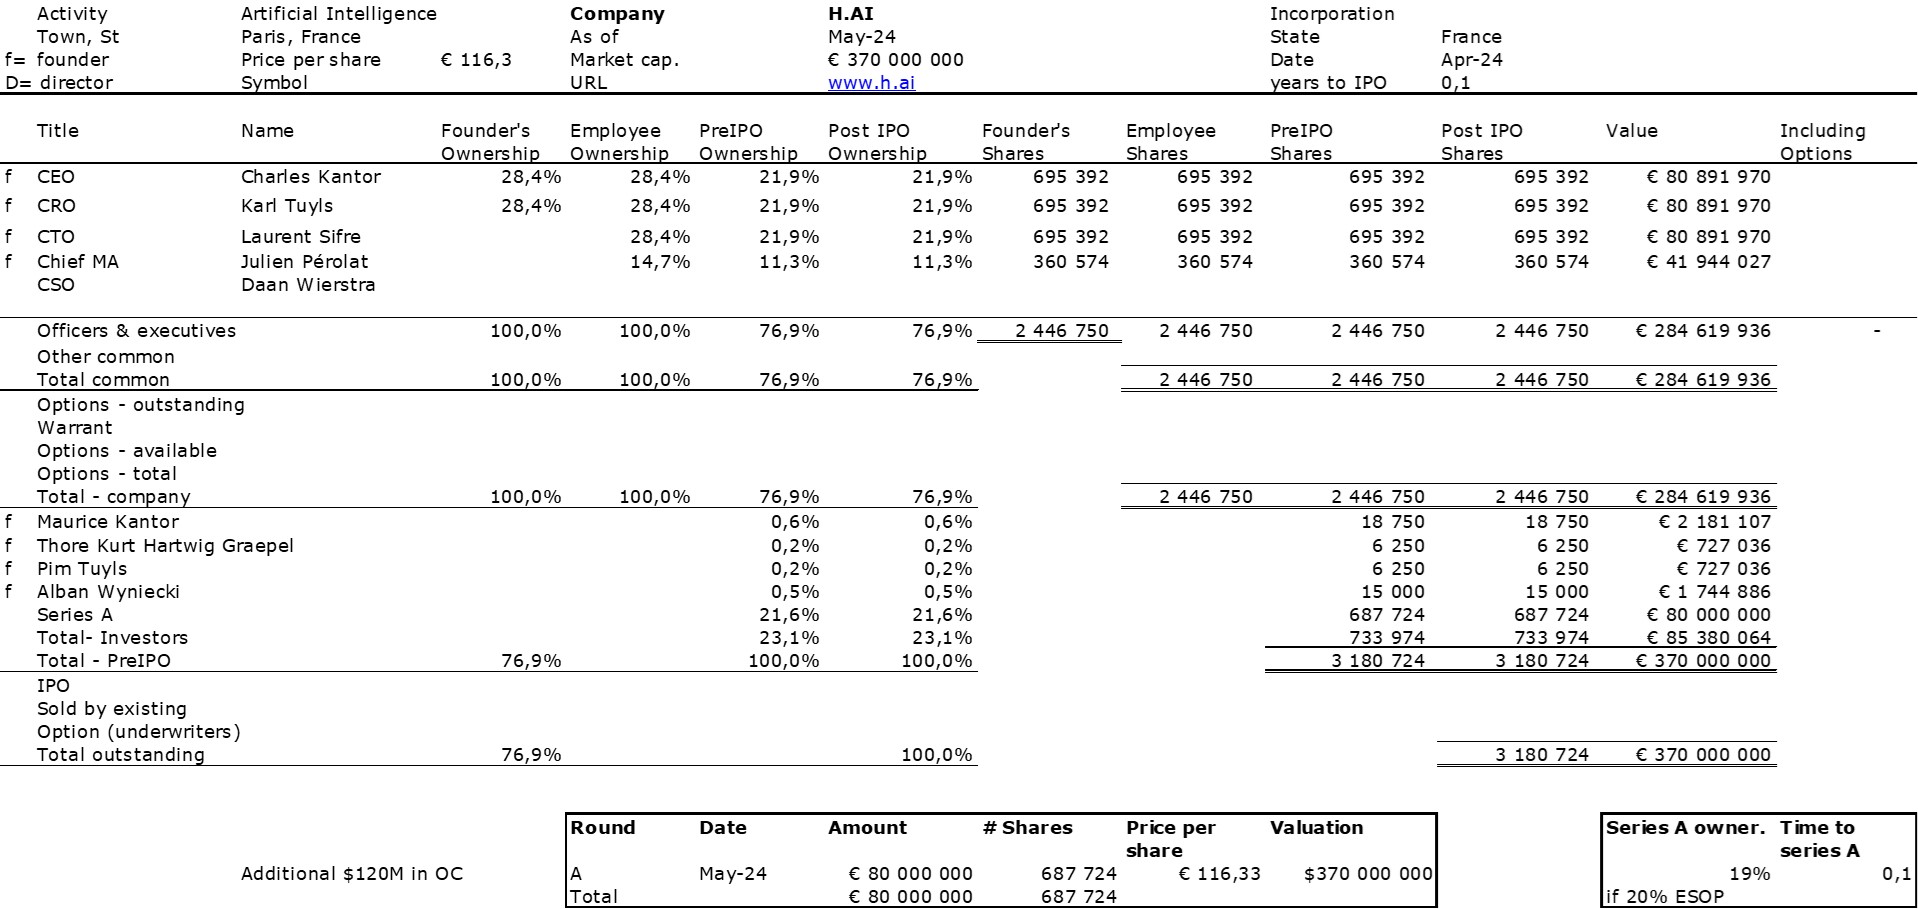
Some of you may know I am a kind of crazy data cruncher. I love data. They provide food for thought. Since 2008, when I published my book, I have been compiling data about startups such as cap. tables. I have now 978 such tables and the last time I published about them was in July 2025 and June 2024. I will celebrate with a long update when I reach 1000 but I have been slow recently with about 20 new tables per year. So we’ll see if the celebration will be in 2026 or 2027.
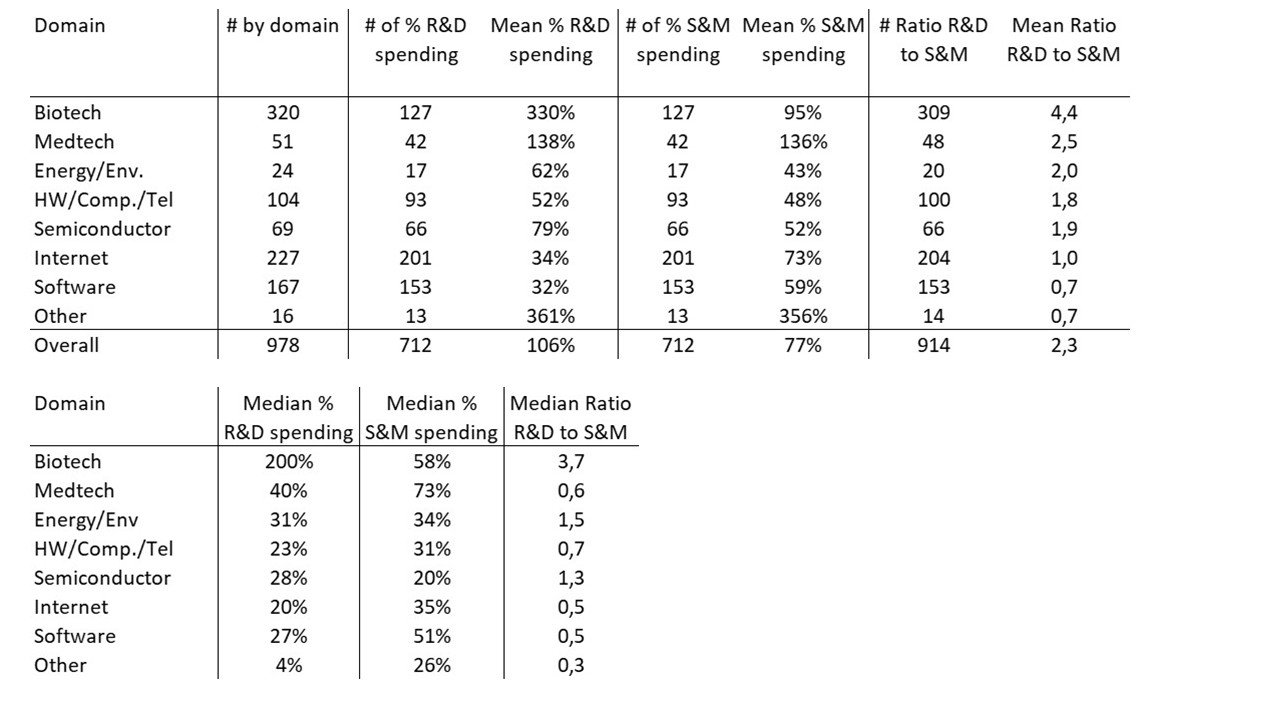
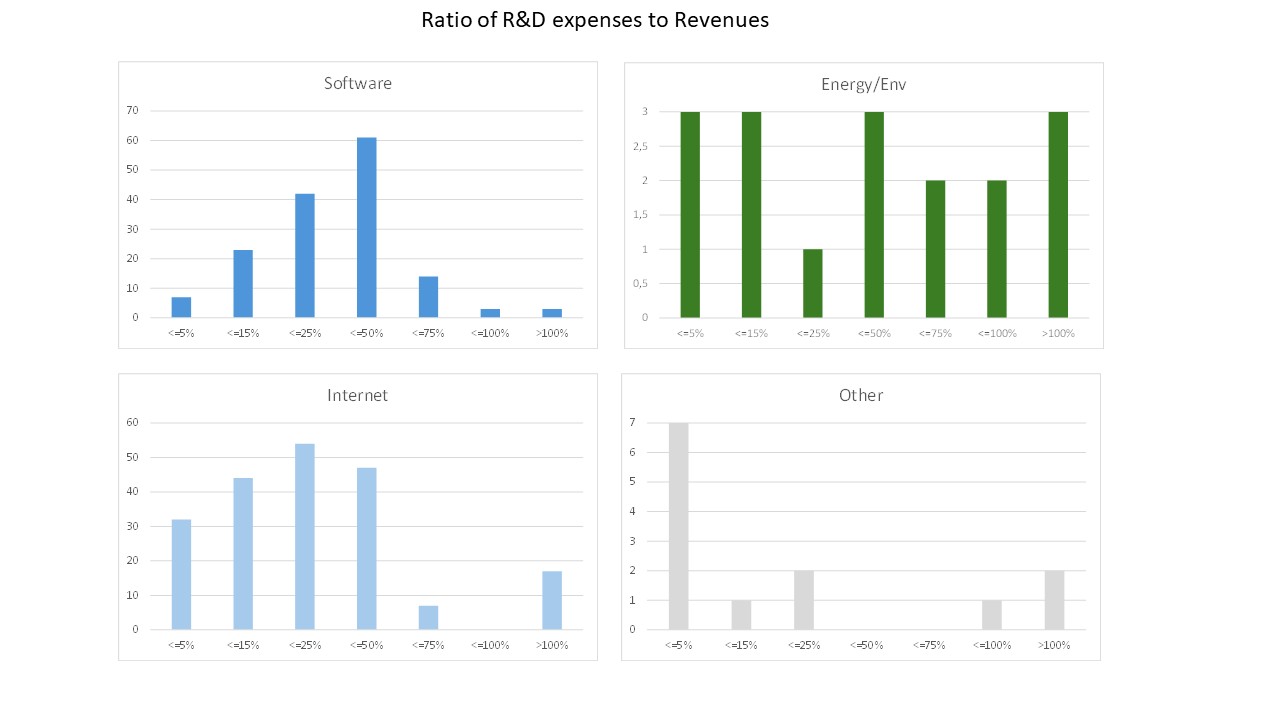
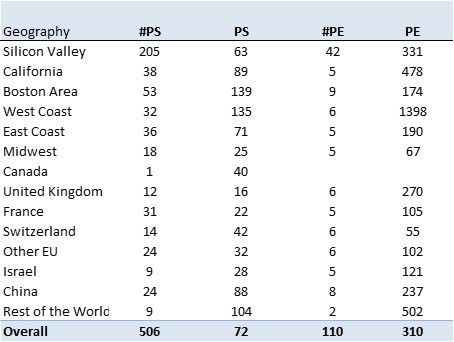
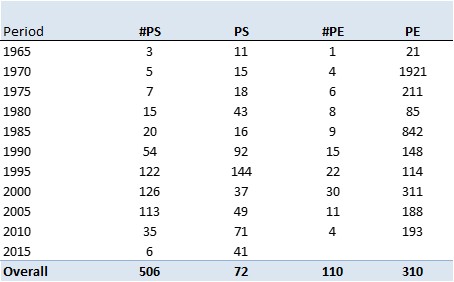
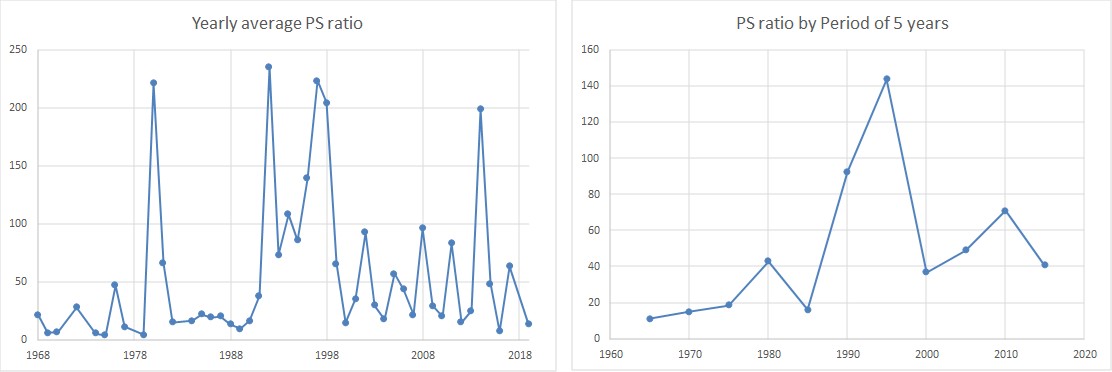
I studied something new here which is the R&D intensity in technology companies and startups. Let me develop. Most of the techology companies I study went public or at least filed to go public at some point in their history. Some were still startups (they might not have validated their business model), some were not anymore. But as technology companies, they often publif the level of R1D investments, but also the level of their expenses in sales & marketing (S&M). As I have data of companies since the 1960s, it would not be fair to look at absolute numbers in $M. SO i tried to llok at relative numbers, the ratio of R&D and S&M compared to total revenues. When the revenue was zero or very weak, this ration does not mean much so I also study the ratio of R&D vs. S&M.
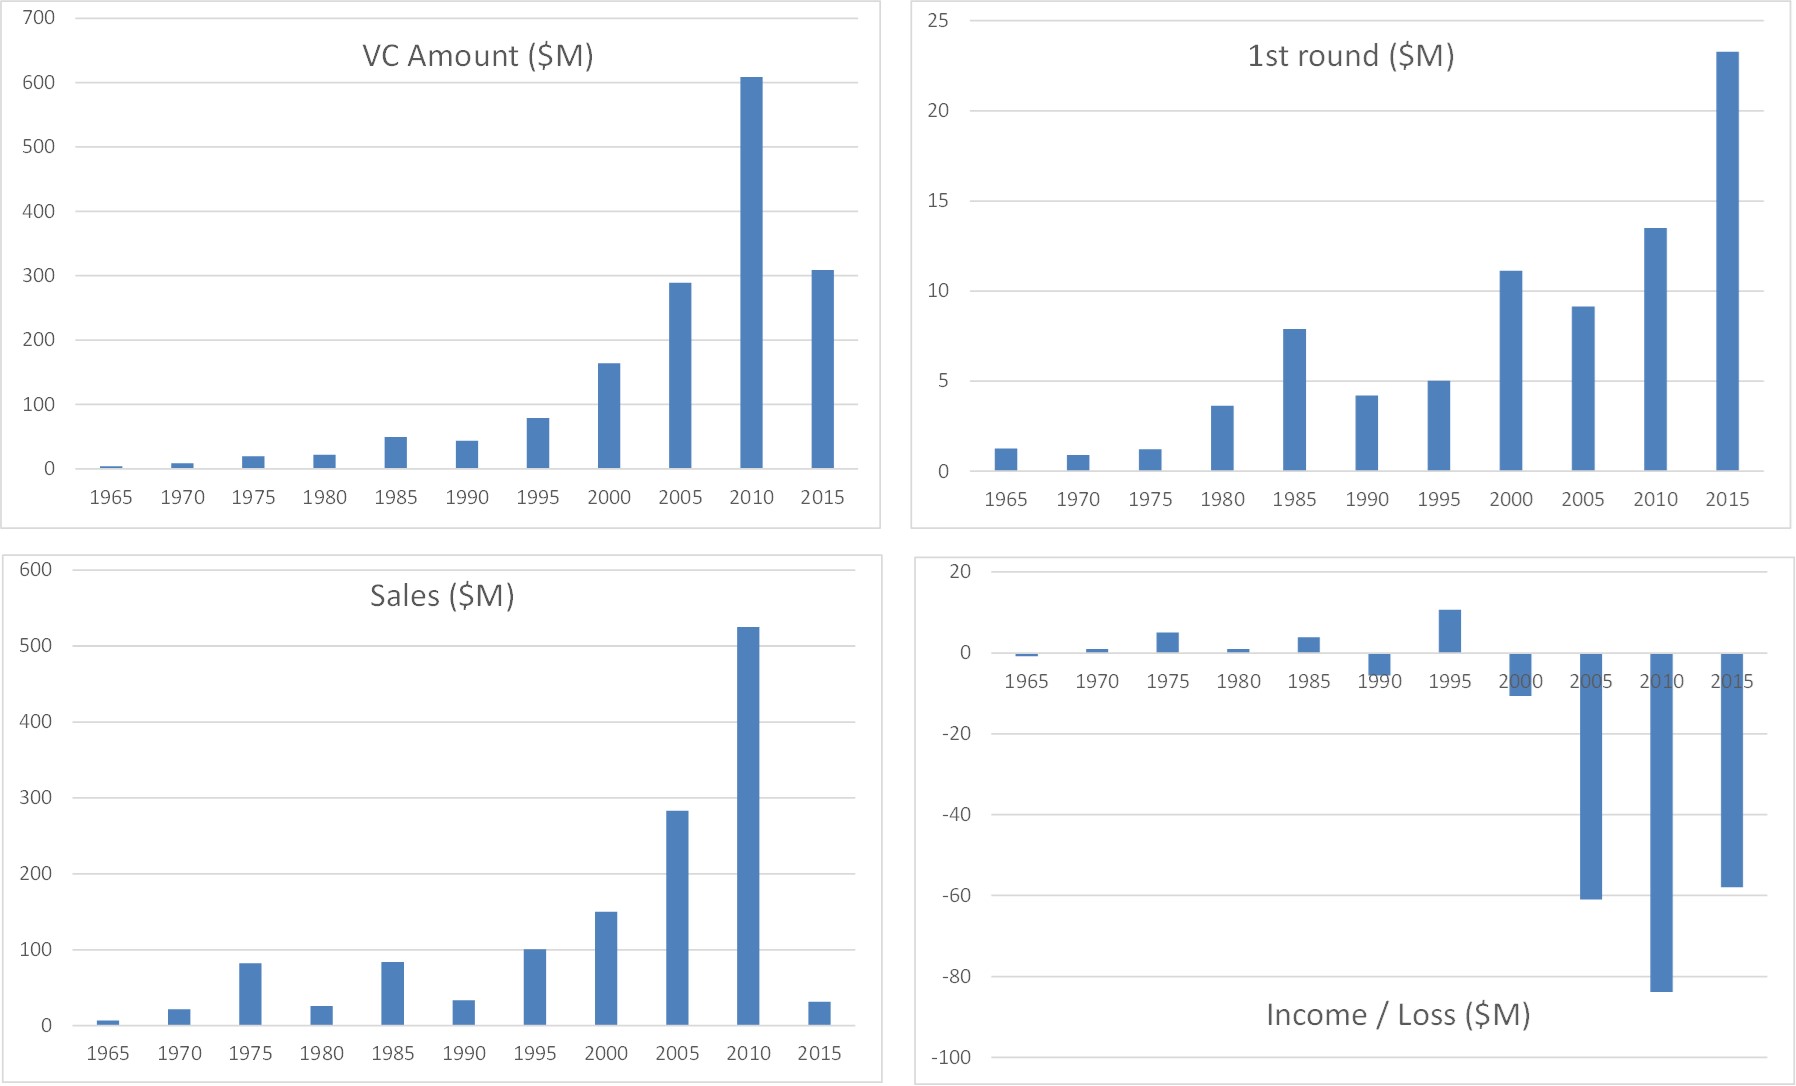
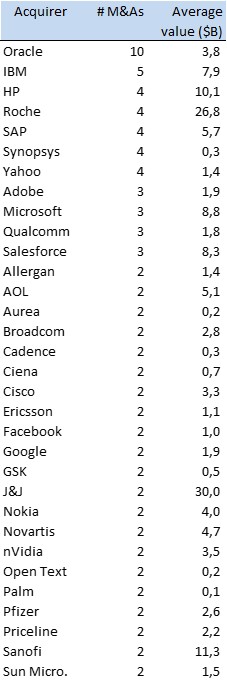
For example, as a first illustration, let us have a look at “my giants”.
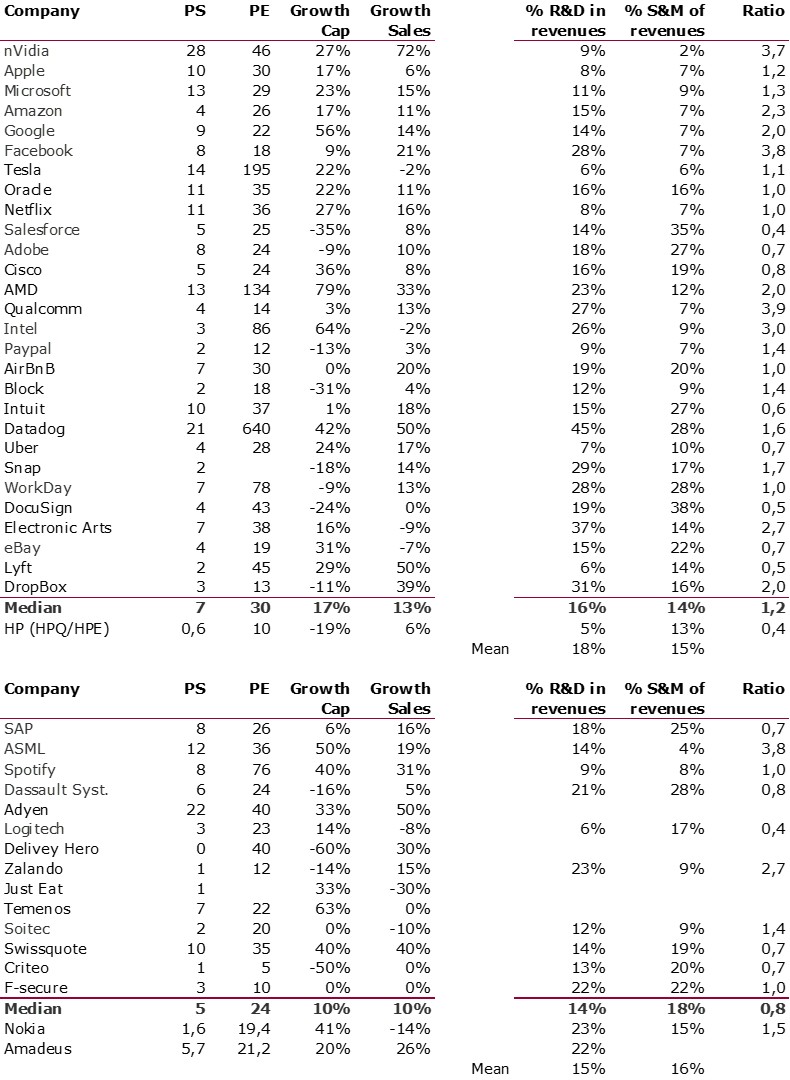
It’s no easy to draw conclusions from this first series. Except that for these “technology giants”, R&D is not as high as I would have thought. R&D is on average close to 15% and rarely at the 25% that I thought common. Still R&D is in general higher than S&M. This relatively low levels are probably linked to the fact that these companies have huge revenues, very high profitability and there is a limit to what you can spend in R&D and S&M.
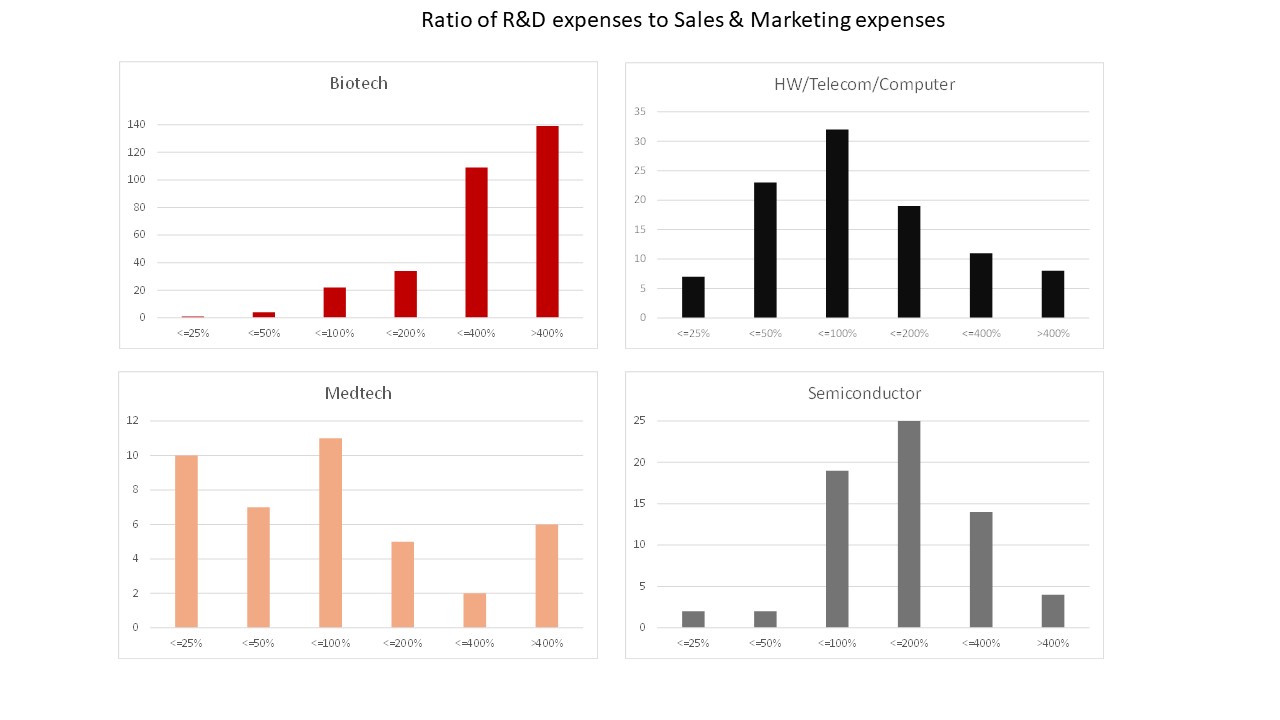
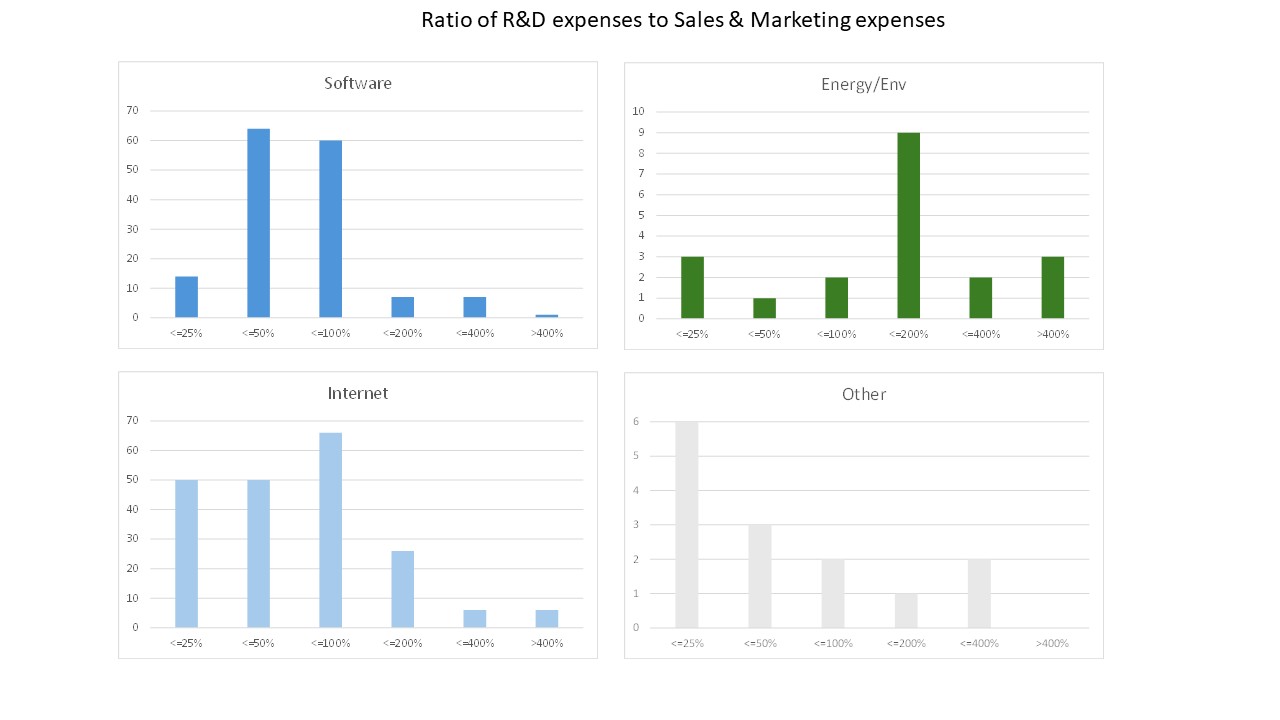
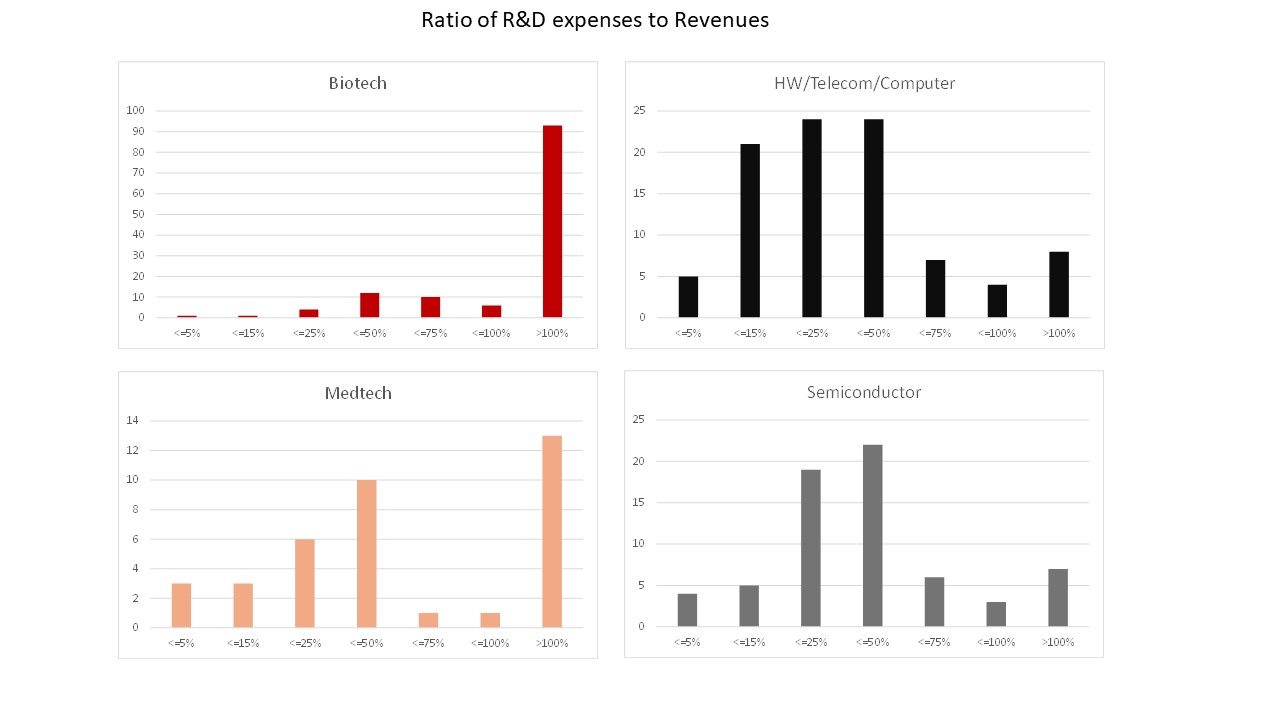
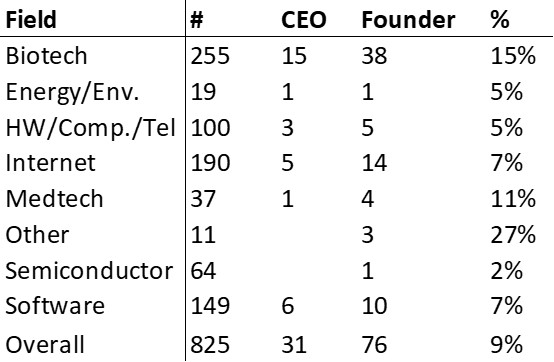
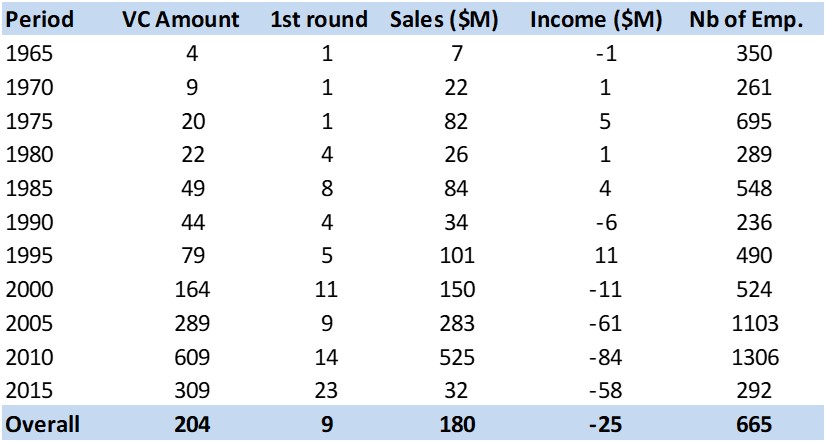
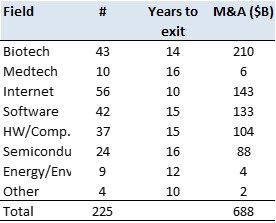
Now let us have a look at the data from the 978 startups.
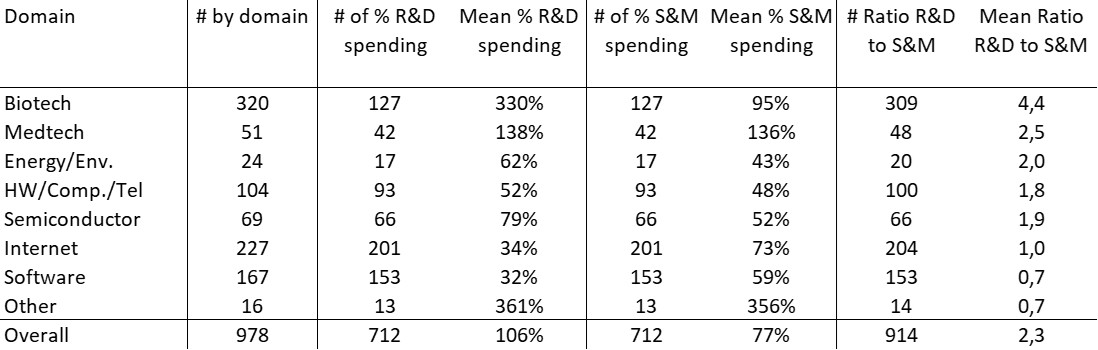
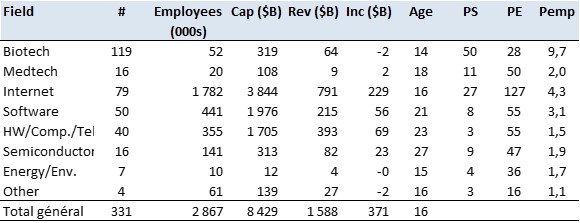
So whether I look at the mean or median, R&D is really high in tech startups. But Sales & Marketing is really high too. It is not sufficient to build things. There is a huge effort to sell them.
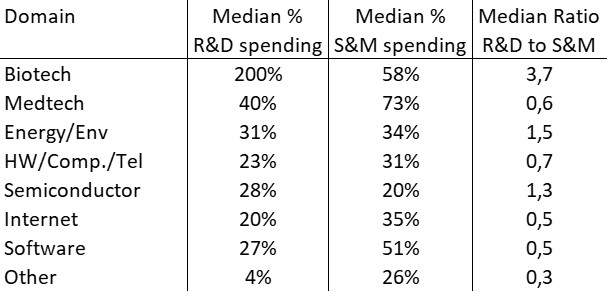
Second, the R&D intensity (as well as S&M) is particularly high in Biotech and Medtech. However this probably come form the fact that the revenue levels are lower in these fields at UPO.
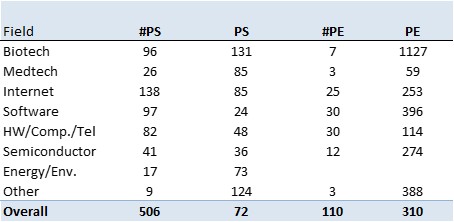
Third, the R&D intensity is the lowest in Software and internet probably because there is less need for R&D but S&M is relatively higher and this shows to in the relative ratio which is 0,5 for the media value of both.
No conclusion but an important Post-scriptum
I will not draw any conclusion but indicate a number of caveats :
– in many cases, R&D is not strictly mentioned but sometimes replace by technology development or product development. Probably for good reasons : in startups, it is not clear there are available resources to do strictly research.
– in many cases, sales and marketing is not mentioned and replaced by selling, general and administration, or even general and administration only. This probably means the focus on sales and marketing is not high enough to be considered separately. In that case, I took what was available.