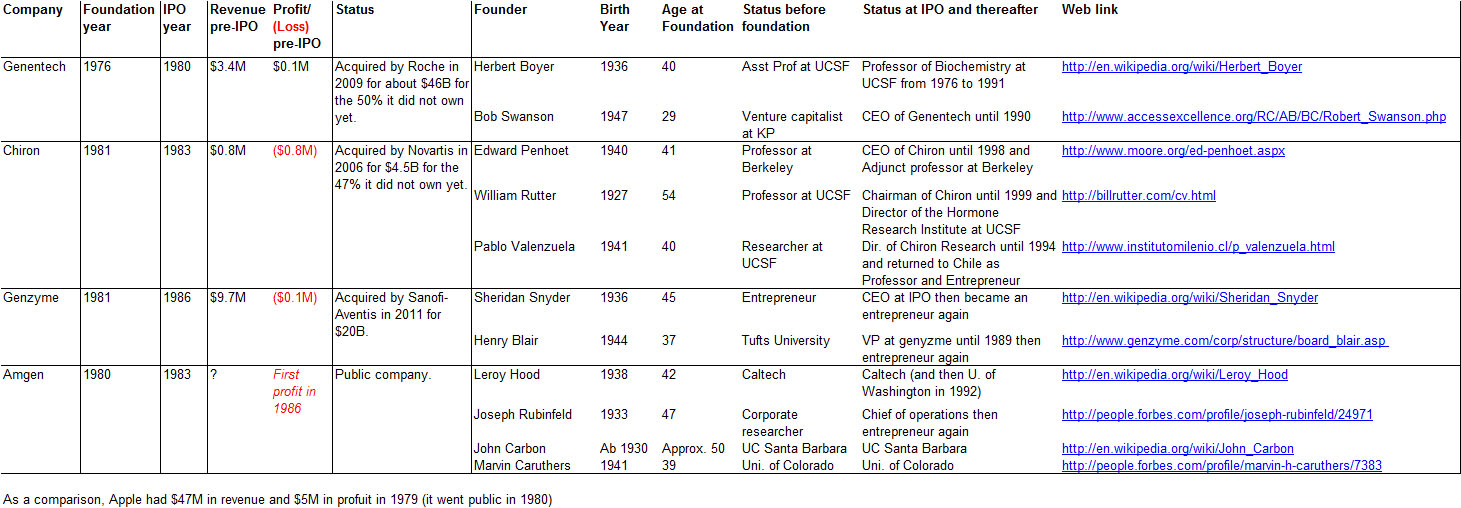
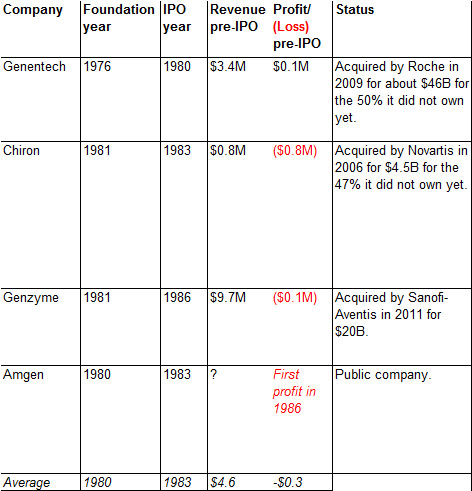
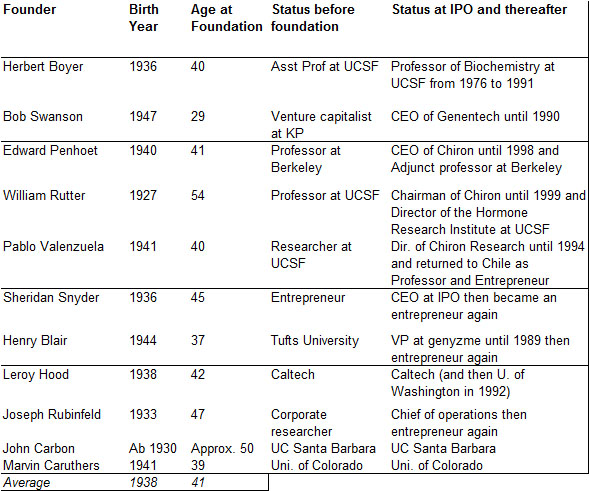
After Genentech, Chiron and Genzyme, let just me do a simple analysis of biotech start-ups. The table which follows summarizes it all and I added Amegn but it is obviously a little tough to read. You can enlarge it however. So you can see data about the companies themselves, foundation year, IPO year, revenues and profit/loss at IPO, current status and then data on founders, their age at foundation, what they were doing before the creation and what they did after the start-up adventure. Then I provide a link on them.
So what is interesting about the companies themselves?
– On average, it takes them 3 years to go public. So the myth that biotech start-ups develop slowly is linked to the revenue/profit status, not the exit status.
– Indeed, when they go public, they have very small revenues and lose money. Compare to Apple for example, on the first picture.
– They are very similar to Internet companies of the late 90s: they go public very soon without revenues and still losing money.
– Finally, they are acquired by European players. This is in total opposition to IT companies where the only buyers are American (check for example slide 36 of the pdf I published in the past).
Now the founders.
– First, they are not young people. Compare again to the same document, slide 27 now. American founders in the slide are on average of 27 year-old, and Europeans, 33 year-old.
– Many had an academic career they did not have to leave. They may have taken sabbaticals but many went back to their academic life. It is obviously related to the previous point.
These 3 posts have shown my small knowledge of biotech but also the fact that they are interesting not to say major differences between Biotech and Information Technology.


