As a follow-up to my recent post on (updated) data on 600 (former) startups, here is a first post about (what I think) are interesting or intriguing results.
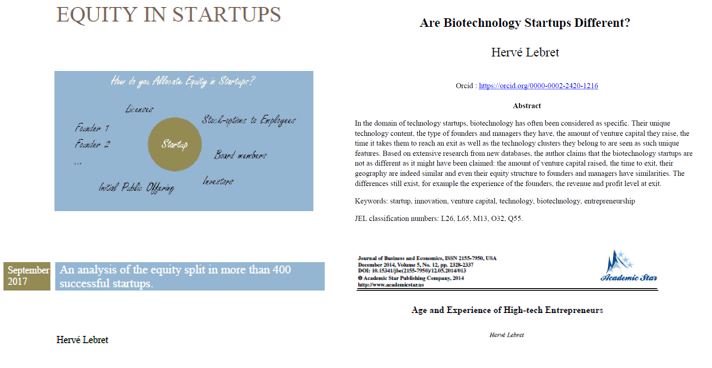
Without doing too much self-promotion, let me add that I have in the past already dealt with the topic as I mentionin the document or through the following illustration:

My first comment is that the differences linked to fields or geographies are not that big, whereas data evolved more over time (fifty years). Amounts of venture capital, years to IPO, sales, profits, employees are not that different for example except in biotech maybe, for sales and employees at least.
One important note: in my list of 600 companies, only 15 did not have venture capital (or at least private investors). Is there a bias here? I am not sure, but I could be wrong.
These “comment” posts will be short and I finish this one with a look at Series A, the 1st investment round. The amounts are substantial, $8M on average. I did a new analysis, i.e. to find out how much VCs take at this stage and on average, it’s … 47%. A little less in IT, a little more in healthcare, a little less in Silicon Valley, a little more in Boston.
If I bring it back to the percentage per million, that gives 22%, I let you think about this astonishing result … but we must also look at the median values, because all this is not gaussian as I have often say, but follows a power law. Median values are $4.5M for Series A in exchange for 45.5% and 10% for $M.
