Yesterday I discovered an Indian startup filed to go public on its national stock exchange. I did not know it, shame on me. Zomato is the latest filing in a small number but extremely visible services in the food delivery sector. Who does not know Deliveroo, Just Eat, Uber Eats and others.
I am not sure that twenty years ago I would have pu the sector in technology innovation, but I have to admit innovation has many faces. On Crunchbase, the sector is said to have 616 organizations with $12.5B in funding (see Crunchbase Food Delivery Startups). Traxn gives the largest players here. So thanks to my database of 777 cap. tables, I could have a look at some statistics, with the exception of FoodPanda (acquired by Delivery Hero, funded with $318M including Rocket Internet), iFood (Brazil, owned by Movile, $587M in funding) and Swiggy (India, $2.5B in funding including Accel). Here are the data at time of the IPO filings.
| Start-up | JustEat | GrubHub | Zomato | Delivery Hero | Deliveroo | DoorDash | Median * | |
| Geography | United Kingdom | Illinois | India | Germany | United Kingdom | Silicon Valley | ||
| Founded | Aug-01 | Feb-04 | Jan-10 | May-11 | Aug-12 | May-13 | Sep-02 | |
| IPO / exit | Apr-14 | Apr-14 | Apr-21 | Jun-17 | Mar-21 | Nov-20 | Mar-13 | |
| Years to IPO | 12,7 | 10,2 | 11,3 | 6,1 | 8,6 | 7,5 | 7,4 | |
| VC Amount | 88 | 86 | 1529 | 1711 | 1856 | 2578 | 84 | |
| 1st round | 8 | 1 | 1 | 4 | 4 | 2 | 4,4 | |
| Sales ($M) | 150 | 137 | 338 | 297 | 1 680 | 885 | 23 | |
| Income ($M) | 10 | 15 | -310 | -202 | -312 | -668 | -14 | |
| Market Cap. | 1 465 | 1 988 | 6 782 | 4 700 | 10 220 | 17 384 | 560 | |
| PS | 10 | 15 | 20 | 16 | 6 | 20 | 17 | |
| PE | 147 | 133 | 102 | |||||
| Nb of Emp. | 886 | 680 | 3 469 | 12 098 | 2 561 | 3 279 | 189 |
*: the median value is based on 777 startups compiled over years. PS and PE are the ratios of market caps to sales and earnings (profit)
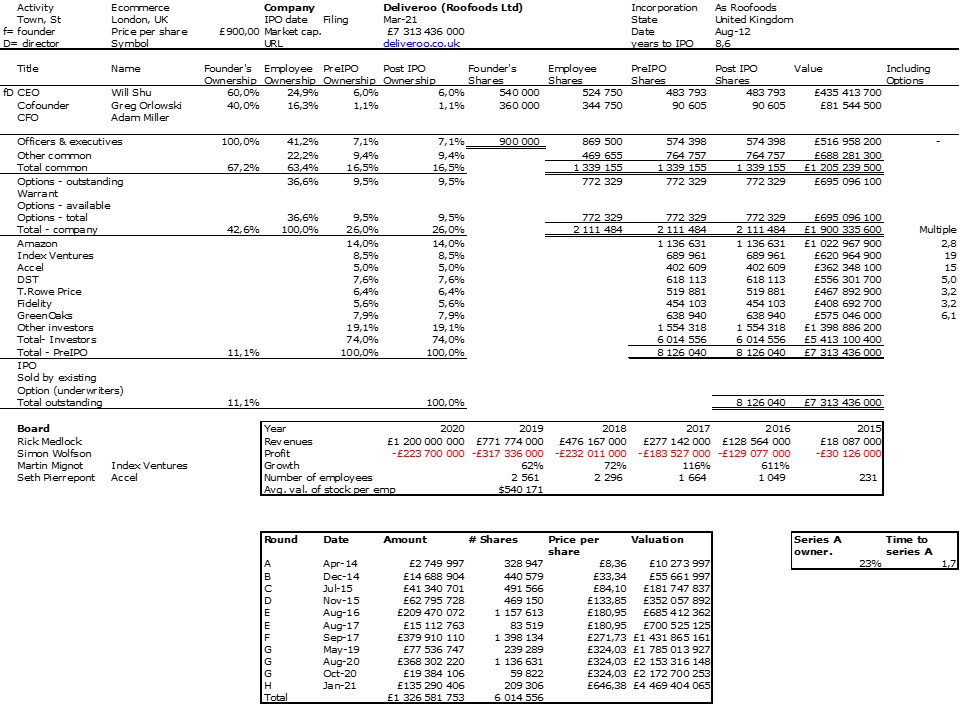
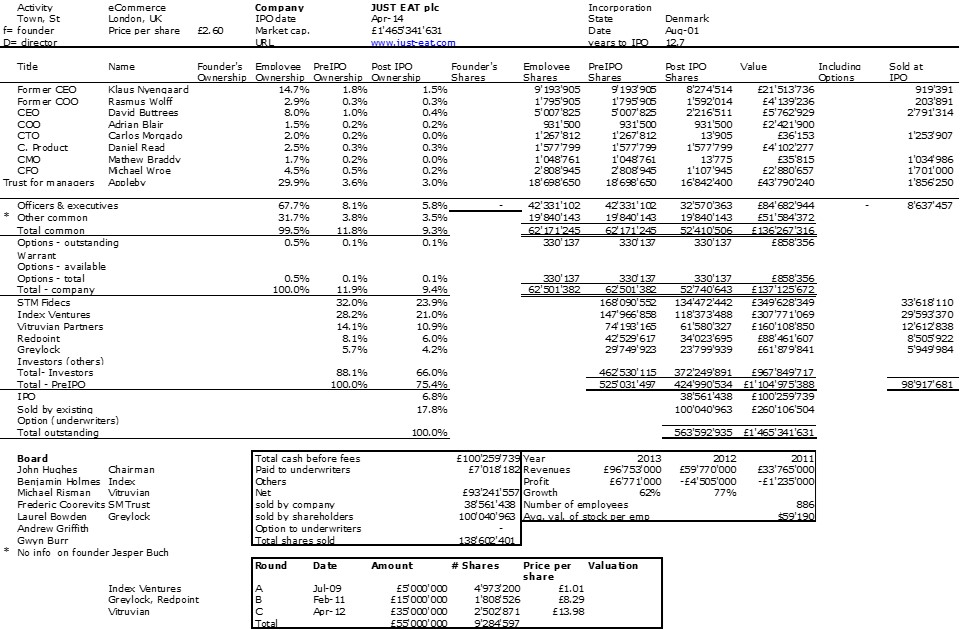
Just Eat has no data on founders as the initial Danish company with 5 founders has been bought and moved/launched in the UK.
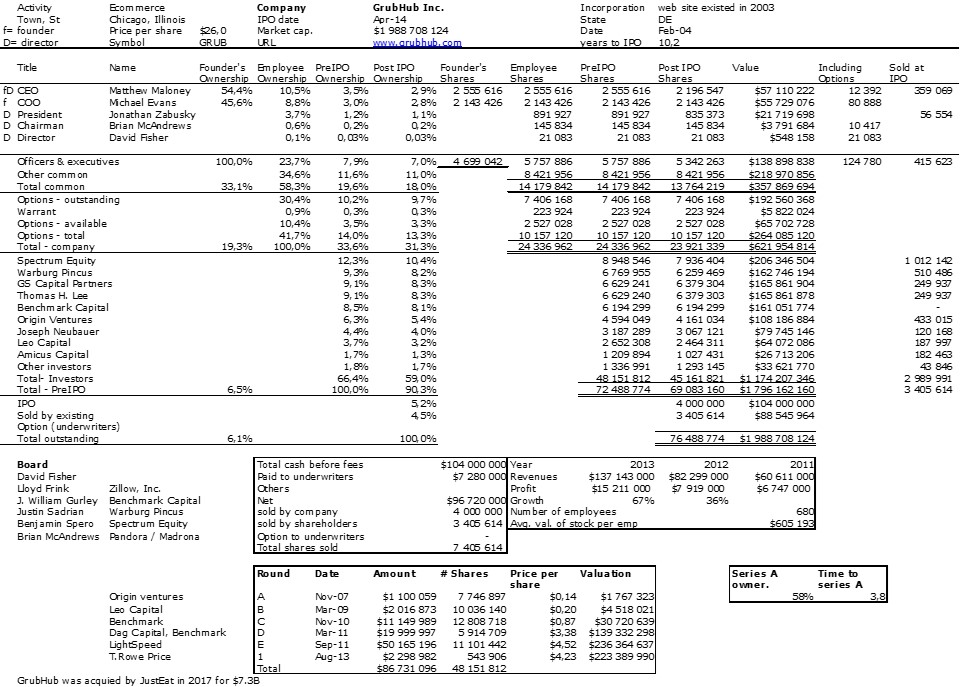
Here are the data to date (GrubHub has been acquired by Just Eat in 2020):
| Market Cap. $B | Sales – $B | Loss – $M | PS | Employees | |
| Just Eat | 15,4 | 2,8 | -151 | 5,4 | 9 000 |
| Delivery Hero | 39,4 | 2,0 | -939 | 19,5 | 35 528 |
| DoorDash | 46,0 | 2,9 | -458 | 15,9 | 3 886 |
| Deliveroo | 6,3 | 1,6 | -225 | 3,9 | 2 060 |
| Zomato | 6,8 | 0,3 | -310 | 20,1 | 3 469 |
What is interesting is the difference in dynamics between companies launched before 2010. Something not really new if you follow this blog, in terms of growth dynammics. Here are some more data about shareholders
| Start-up | JustEat | GrubHub | Zomato | Delivery Hero | Deliveroo | DoorDash | Median * | |
| Found. | 5,7% | 6,2% | 4,5% | 7,1% | 12,0% | 9% | ||
| Emp. | 9,4% | 25,1% | 7,0% | 17,2% | 18,9% | 18,5% | 21% | |
| Emp. shares | 9,3% | 12,1% | 3,1% | 11,7% | 9,4% | 4,8% | 8% | |
| ESOP-granted | 0,1% | 9,7% | 0,6% | 5,5% | 9,5% | 11,8% | 8% | |
| ESOP-reserved | 3,3% | 3,3% | 1,9% | 5% | ||||
| Dir. | 0,2% | 0,06% | 0% | |||||
| CEO | 1,0% | 3% | ||||||
| VP | 0,2% | 1,1% | 0,2% | 0,2% | 0,8% | 1% | ||
| CFO | 0,2% | 0,3% | 0,2% | 1% | ||||
| Investors | 66,0% | 59,3% | 70,2% | 59,9% | 74,0% | 68,7% | 51% | |
| IPO | 24,6% | 9,7% | 16,6% | 18,4% | 0,6% | 16% | ||
| Total | 100% | 100% | 100% | 100% | 100% | 100% | 100% | |
| Nb of Dir. | 2 | 2 | 2 | |||||
| Dir % | 0,1% | 0,03% | 0,2% | |||||
| Nb of found. | 2 | 4 | 3 | 2 | 3 | 2 | ||
| Found. % | 2,9% | 1,6% | 1,5% | 3,6% | 4,0% | 4,5% | ||
| Found. age | 27 | 31 | 31 | 33 | 23 | 37,6 | ||
| F1 | 28 | 27 | 31 | 33 | 29 | |||
| F2 | 26 | 29 | 33 | 21 | ||||
| F3 | 31 | 20 | ||||||
| F4 | 38 |
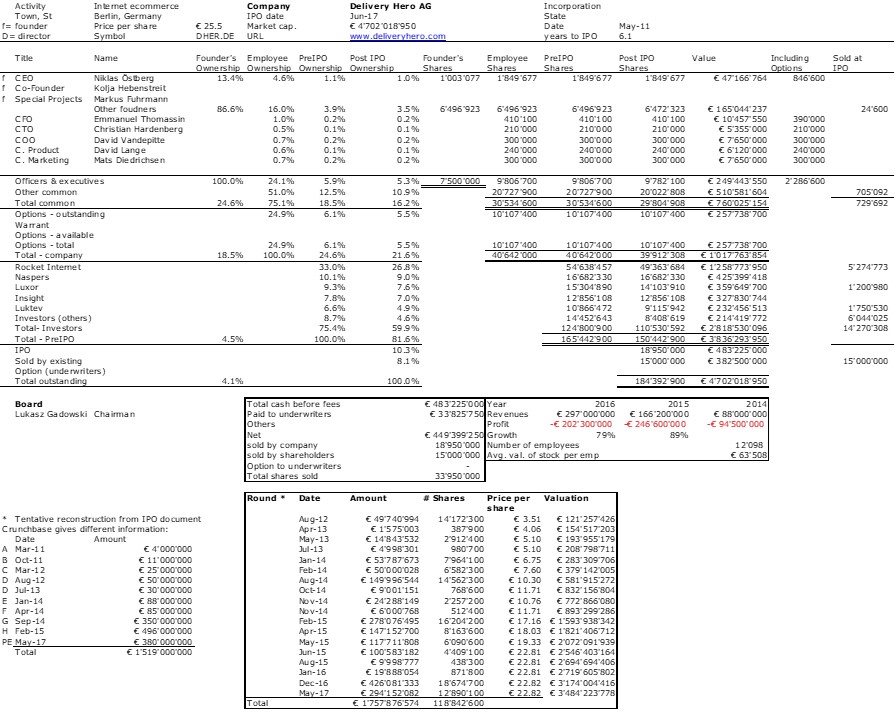
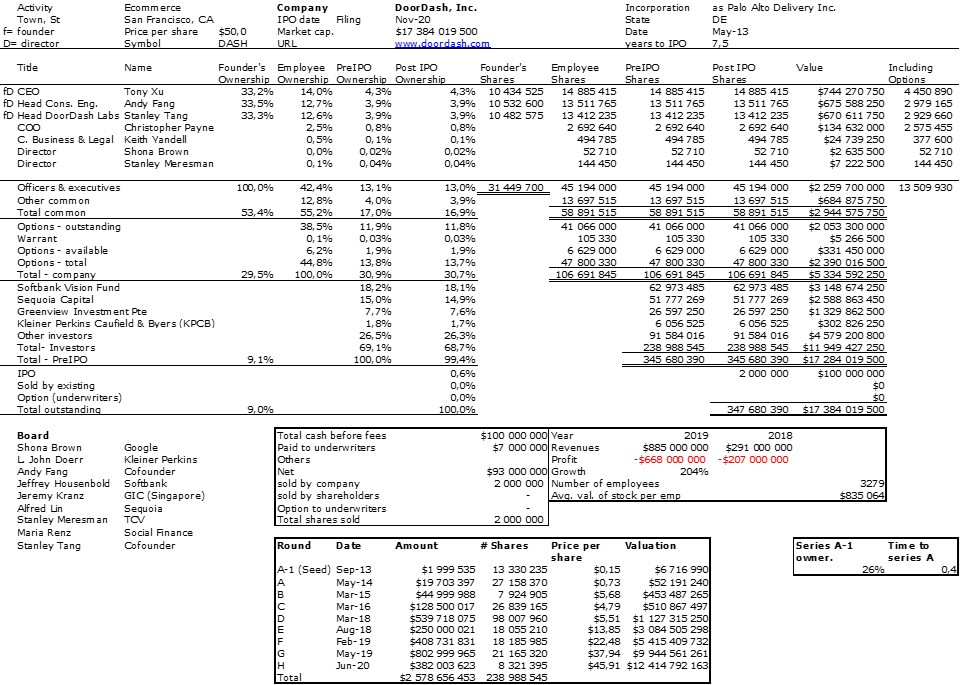
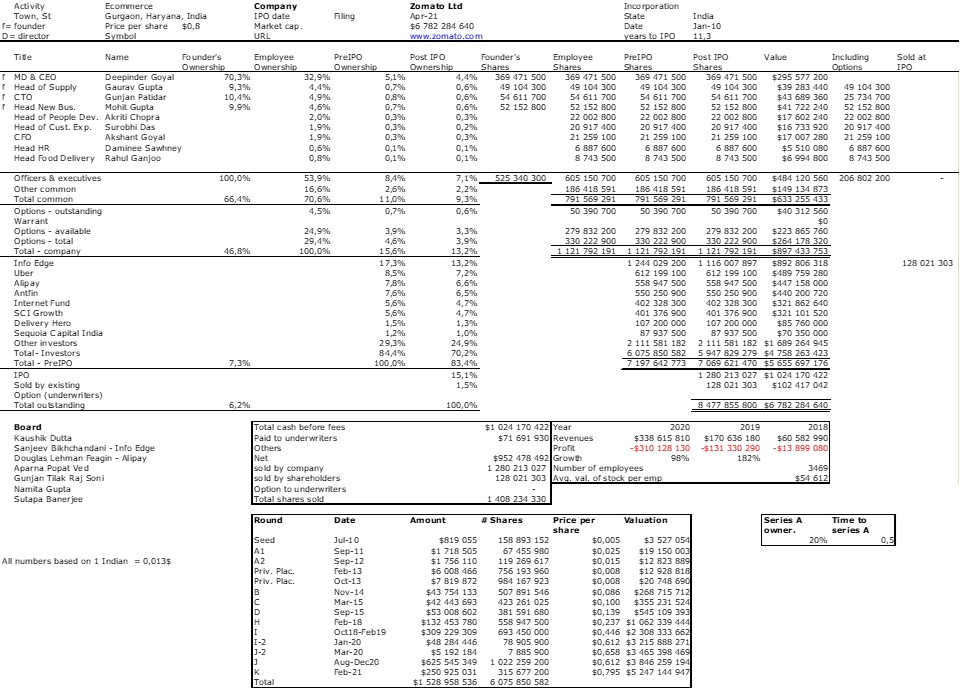
The founders are young, own little. How teh sector will develop, I do not know. There is already concentration. Barriers to entry look low. Some experts have doubt about long term profitability… tough to say. Deliveroo shows no IPO shares as the initial filing did not include any new shares. It may have changed at the recent IPO which was not a success; and here are the individual cap. tables.