Category Archives: Start-up data

Board members and equity in start-ups

I’m regularly asked how to share or distribute equity in start-ups. One related question is how much equity should be given to board members. I am not discussing here investors’ seats on the board as they represent the equity owned by the funds, but only the independent board members, those who have a specific expertise to help the company (industry expert, scientific expert, business expert). There is an implicit assumption: board members do not receive cash (except the reimbursement of out of pocket expenses).

As a general rule, I heard many times that the independent board members as a group should not represent more than 2% of the company, and individual board member not more than 0.5-1%. (As a comparison, I had mentioned in documents in the past (including Equity Split in Start-ups) that a CEO is about 5-10%, a VP between 0.5 and 2% and a technical director about 0.2%. The rule of thumb is dividing by 5 at each level, CEO 5, VP, 1, director 0.2).

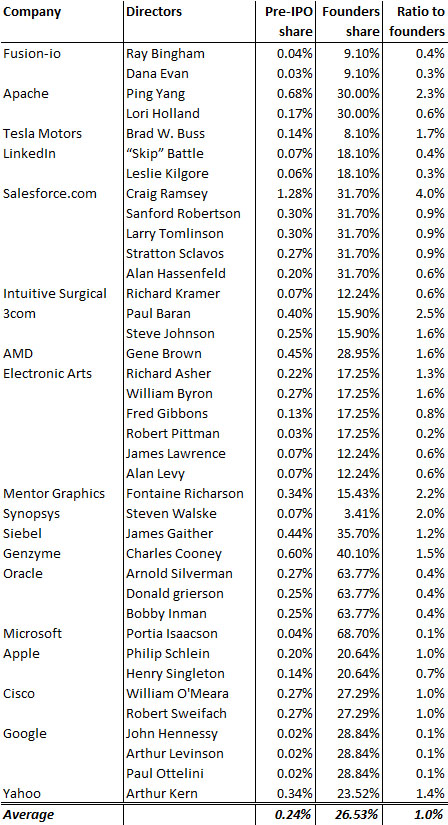
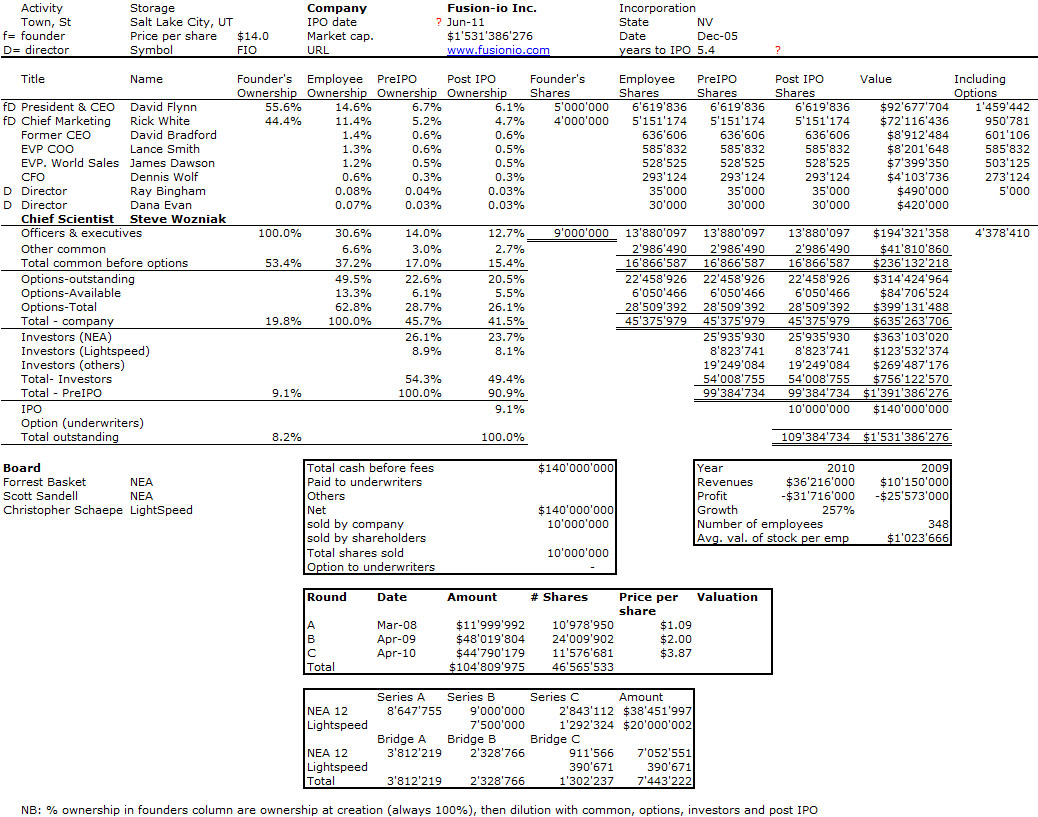
I just had a look at my past cap. tables and S1 documents and listed below examples of independent board members. The table gives the company and board members’ names and then how much the director had just before the IPO, which is related to the founders’s specific shares. On average, they have 0.24% of the company and about 1% of what founders own. This is consistent with what I had been saying for years. 🙂

Wozniak is back!

Going through the higher and higher number of IPO filings, I was suprised to find Wozniak’s names among the officers of one the filing companies. Steve Wozniak, Apple co-founder, is the chief scientist of Fusion-io, a Salt Lake City start-up which has raised more than $100M with NEA and LightSpeed and made more than $30M in revenues in 2010.

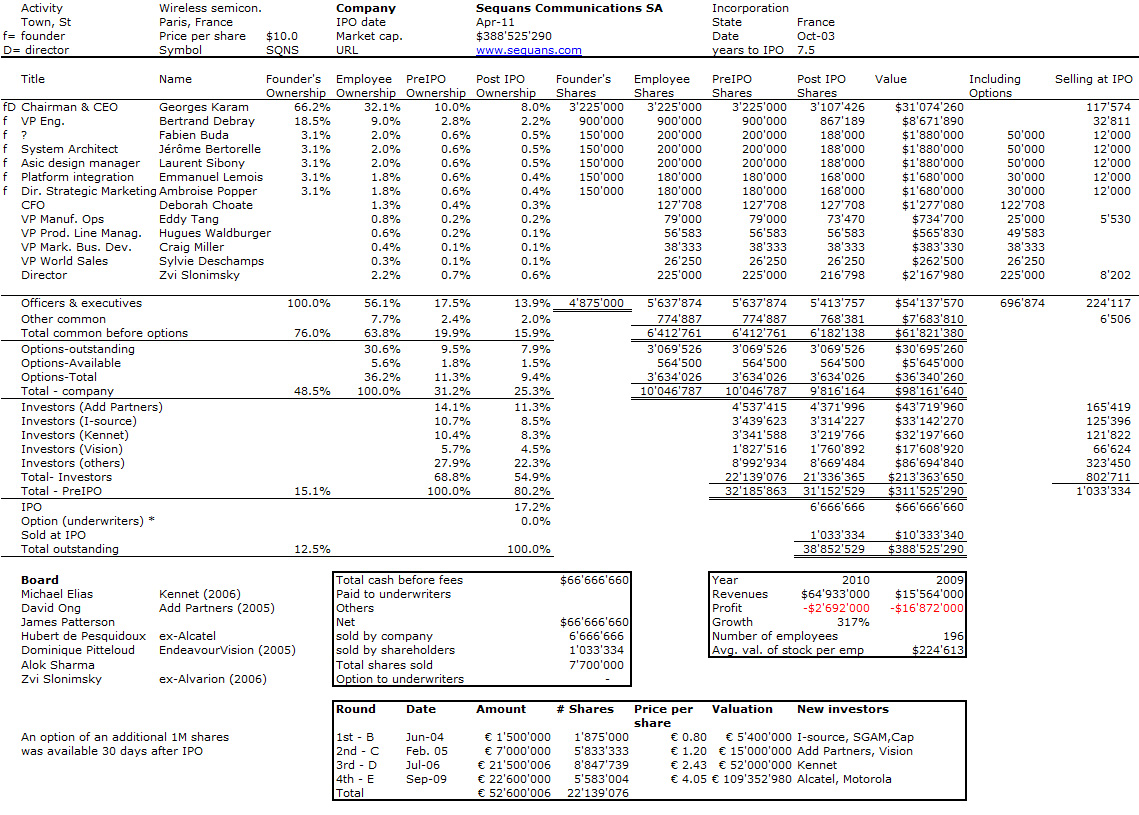
Wozniak is neither a founder nor apparently a big shareholder. At least the S-1 filing does not mention his stake, which means that he has less than 5% of the company. My usual cap. table shows typical numbers. The two founders remain with 6.1 and 4.7% each, investors have about 50% of the company and the ESOP is 20% (25% if I include available options for future grants). All this assumes the company goes public and includes the future IPO shares.

One detail I will focus on in a post to come is equity given to independant board members (VCs are on the board but usually do not own equity personally). Here Ray Bingham and Dana Evan own 0.03% of the company and less than 1% of the founders shares.

The deal that made Bill Gates rich

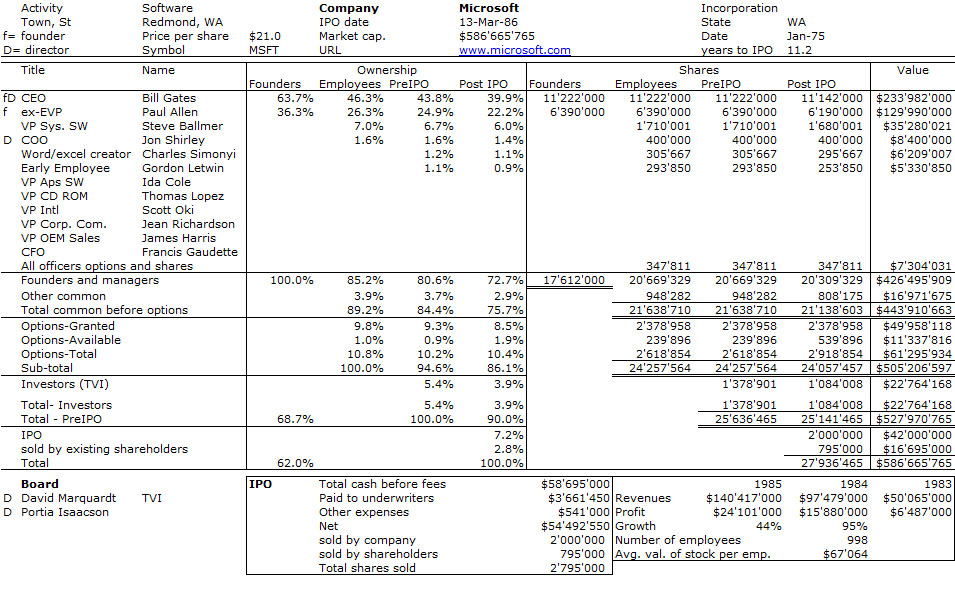
I was having a chat with an EPFL professor who asked be if I had read the reprint of the Business Week article about Microsoft IPO. I had not even heard of it. It is a very interesting description of the IPO process so even it is a long article, you should read it.

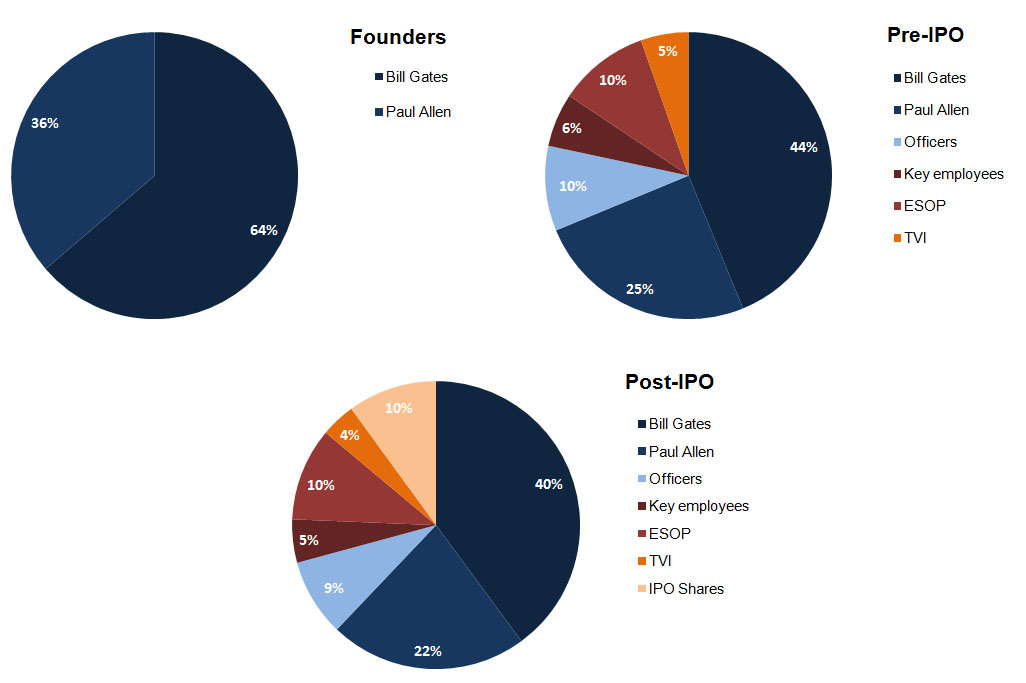
I had included Microsoft cap. table at IPO in my book and here is a slightly improved version. It is interesting to notice that
– Microsoft had been founded 11 years earlier,
– Microsoft did not need to go public (just as Google a few years ago and Facebook today).
– There was very little venture capital money, so Gates and Allen were not much diluted.

The return of Electronic Design Automation? Apache IPO Filing.

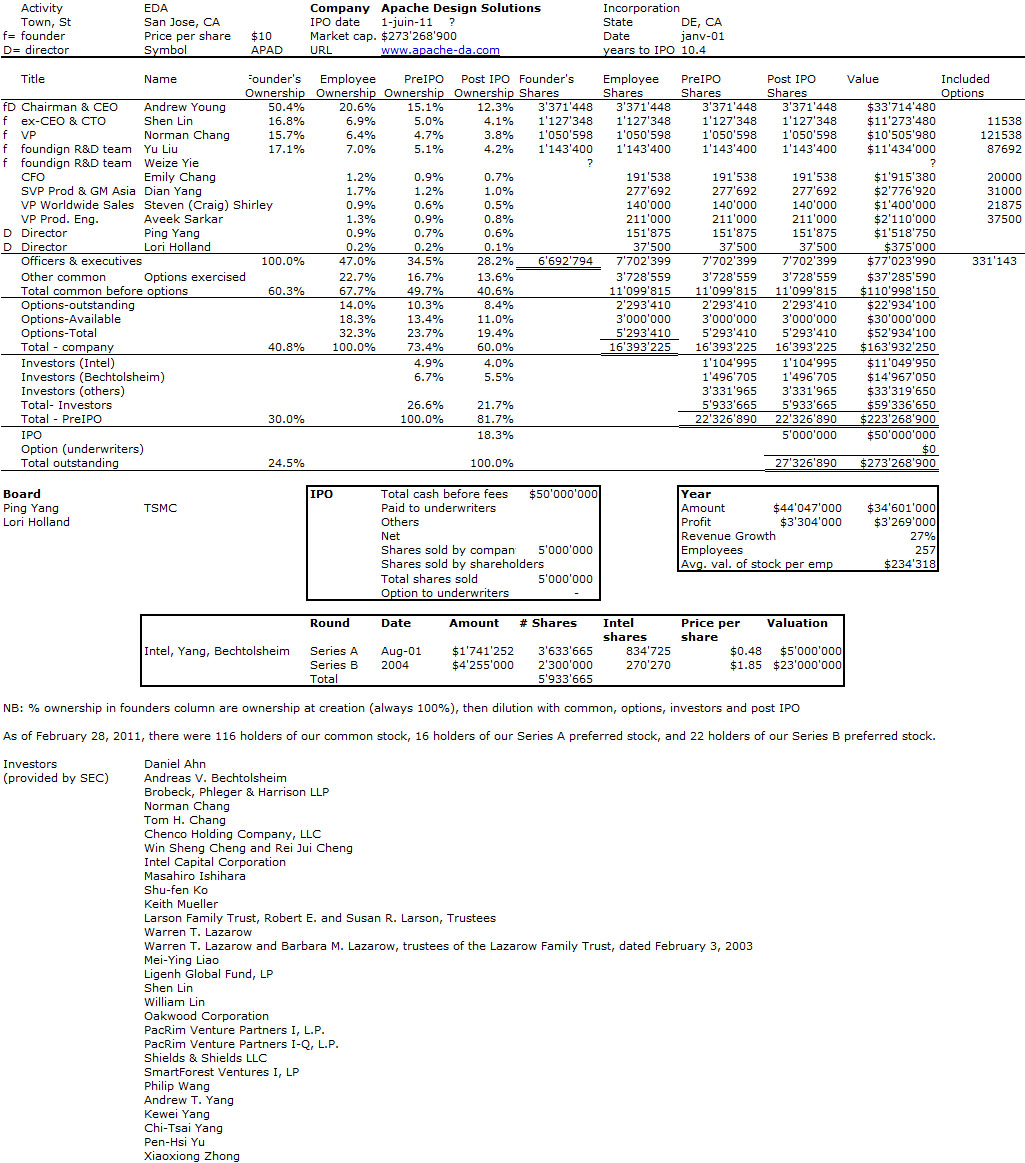
As you noticed recently if you read this blog, IPO filings are piling up. The latest one (I heard of) is Apache Design Solutions and it is very interesting for me because the company belongs the the field of Electronic Design Automation (EDA) which I covered as a full chapter of my book and I follow from time to time the EDA domain on this blog.

EDA is an interestign market because it has reach maturity so you can look at its dynamics over 30 years. I will come back on it at the end of the post. But first, Apache. John Cooley on his DeepChip web site has the best possible description of the company: A brief history of Apache and its IPO.

So here is my usual cap. table. It took Apache 10 years to file despite the fact that the company has been profitable for many years. Not very famous investors (though Intel and Bechtolsheim are not bad!), solid revenues and profits. It shows how much the tech sector has suffered. Such companies would have been public easily ten years ago. In fact,a s Cooley notices, tehre has not been any EDA IPO since 2001.

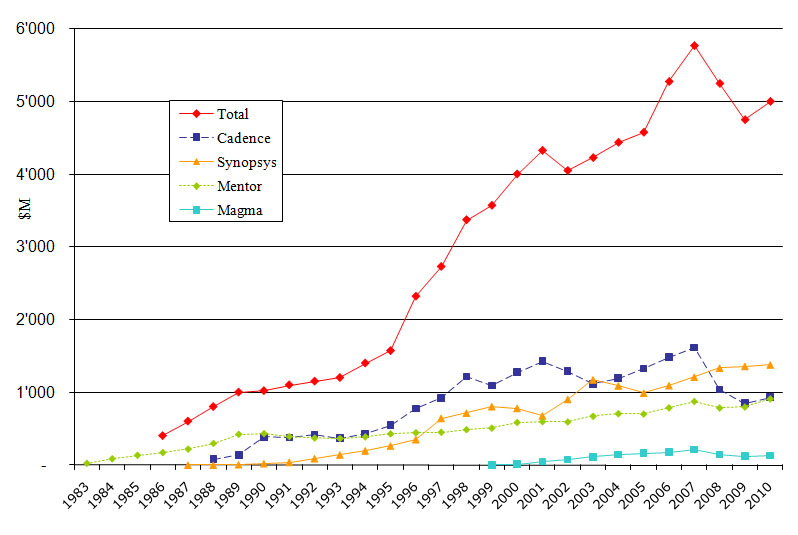
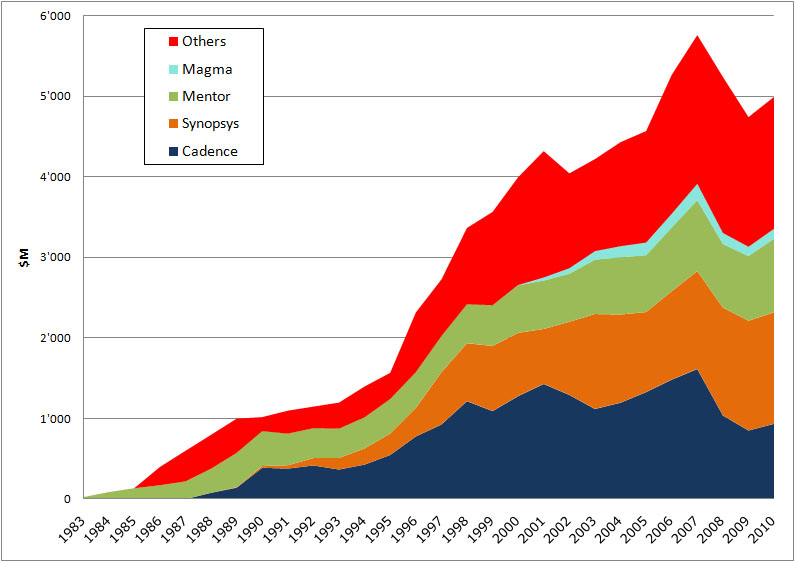
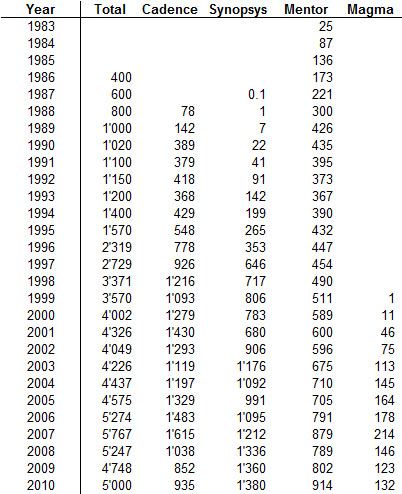
So what about the EDA market? The last EDA IPO in 2001 was… Magma. I will just let you look at the market data and judge about the market.


Figure 1 – EDA Market and Players 1983, – 2010.


Figure 2 – EDA Market and Players, 1983 – 2010.


Table 1 – EDA Market and Players, 1983 – 2010 (Revenues in $M).

NB: the 2010 figures for Total and Magam are assumptions (as they are not known yet).

Biotech data – part 3/3: A short synthesis

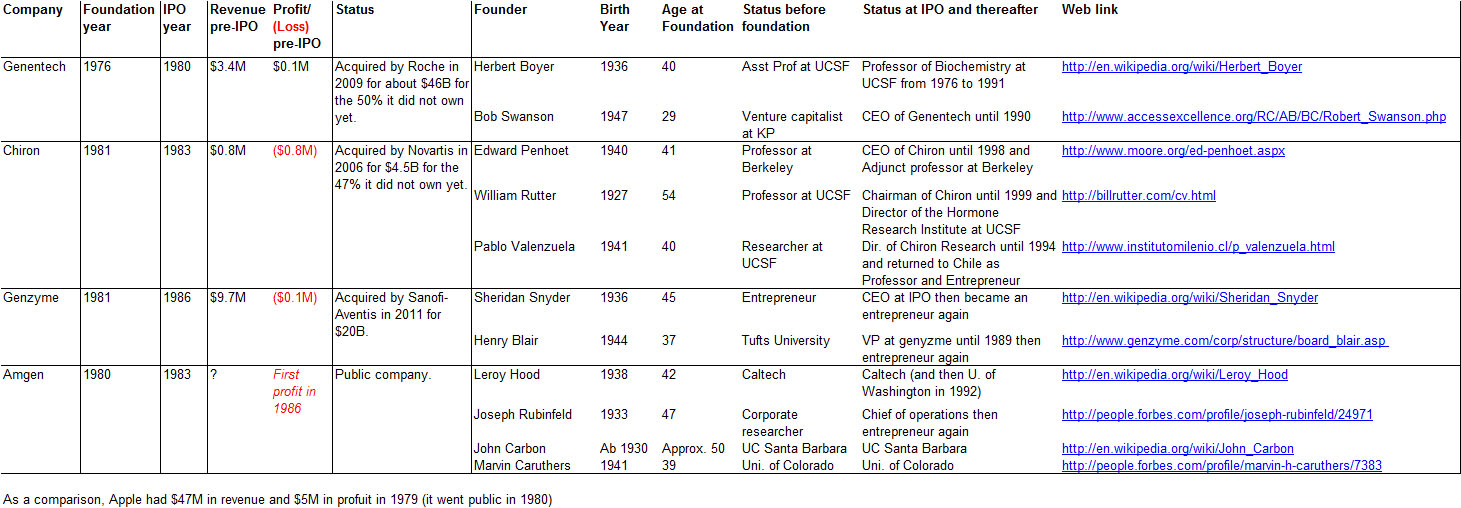
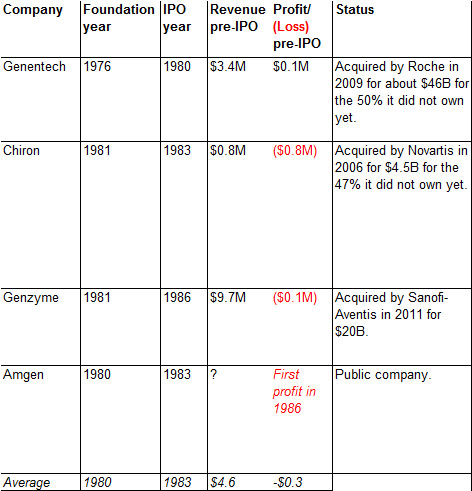
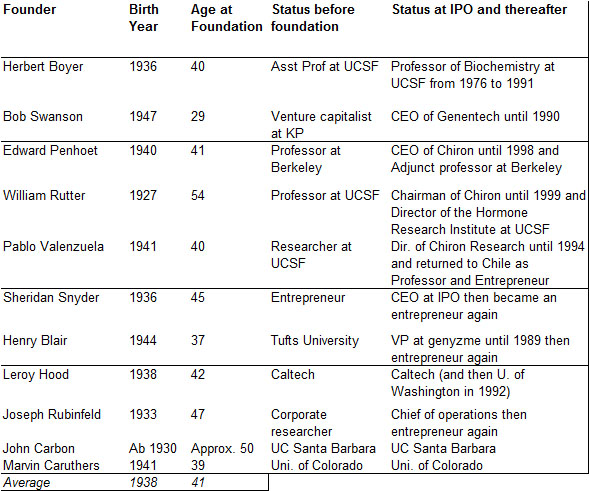
After Genentech, Chiron and Genzyme, let just me do a simple analysis of biotech start-ups. The table which follows summarizes it all and I added Amegn but it is obviously a little tough to read. You can enlarge it however. So you can see data about the companies themselves, foundation year, IPO year, revenues and profit/loss at IPO, current status and then data on founders, their age at foundation, what they were doing before the creation and what they did after the start-up adventure. Then I provide a link on them.

So what is interesting about the companies themselves?

– On average, it takes them 3 years to go public. So the myth that biotech start-ups develop slowly is linked to the revenue/profit status, not the exit status.
– Indeed, when they go public, they have very small revenues and lose money. Compare to Apple for example, on the first picture.
– They are very similar to Internet companies of the late 90s: they go public very soon without revenues and still losing money.
– Finally, they are acquired by European players. This is in total opposition to IT companies where the only buyers are American (check for example slide 36 of the pdf I published in the past).

Now the founders.
– First, they are not young people. Compare again to the same document, slide 27 now. American founders in the slide are on average of 27 year-old, and Europeans, 33 year-old.
– Many had an academic career they did not have to leave. They may have taken sabbaticals but many went back to their academic life. It is obviously related to the previous point.

These 3 posts have shown my small knowledge of biotech but also the fact that they are interesting not to say major differences between Biotech and Information Technology.

Biotech data – part 2/3: Genzyme

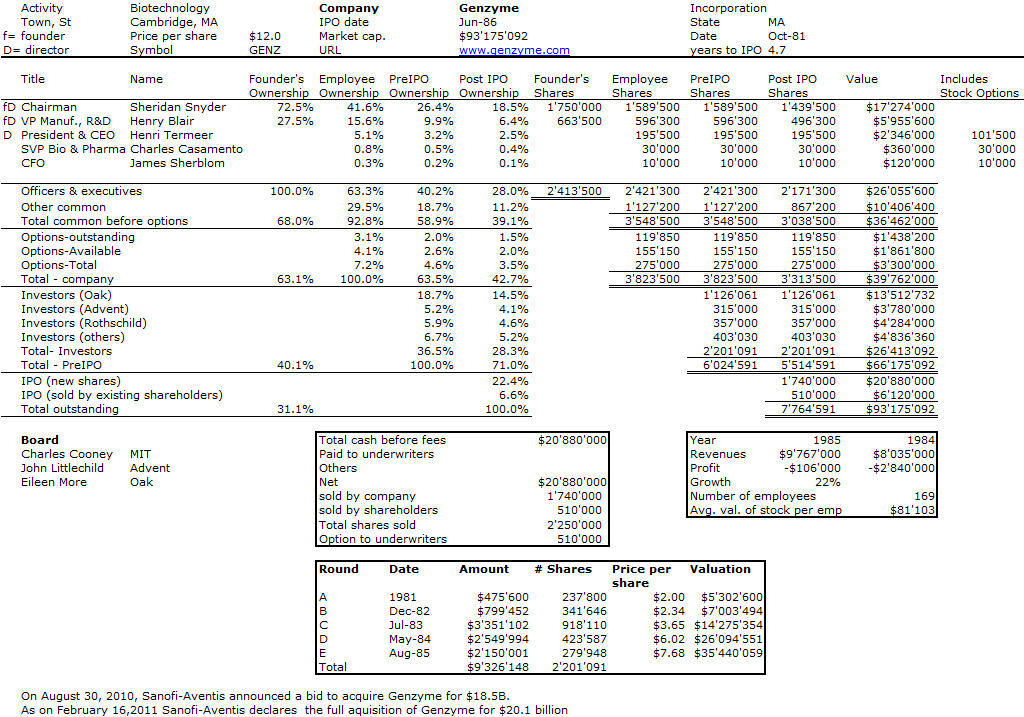
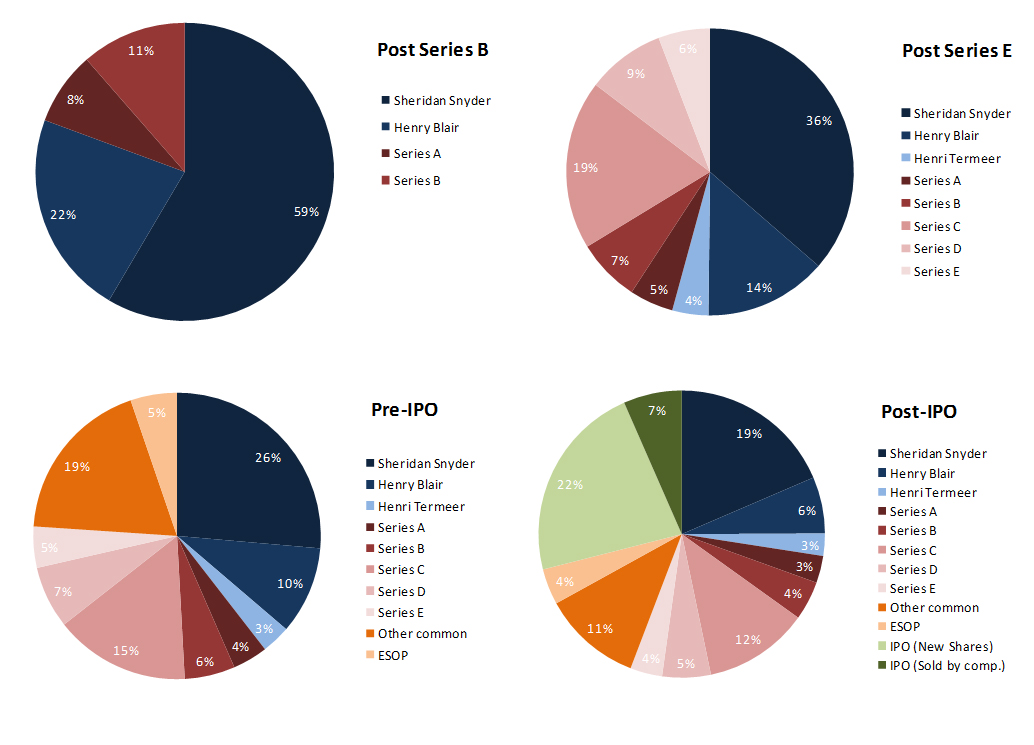
Genzyme is the second topic of my biotech series. Same approach as with Chiron. Genzyme was founded in 1981, went public in 1986, in less than 5 years. It had two founders, Sheridan Snyder and Henry Blair. It should be added that Henri Termeer was instrumental in the company success. Snyder was 45 and an entrepreneur who after Genzyme will create again new companies. Blair was a researcher at Tufts and was 37. He would become an entrepreneur again.

Genzyme had some revenues but no profit when it went public. Oak was the main investor and both Advent and Rothschild had about 5-6% of the company. Interestingly enough, just like Genentech (with Roche) and Chiron (with Novartis), Genzyme has been recently acquired by a European pharma: Genzyme has been acquired by Sanofi-Aventis for $20B.

Next: a few features about Biotech founders and start-ups.

Biotech data – part 1/3: Chiron

Biotech is a strange world for me. I am an IT guy and I have never really understood much about biology. The biotech start-ups are also very different from IT companies. It is well-known that it takes them years to reach revenues with products (not R&D revenue), not to say profitability (just like the semiconductor industry). It does not prevent them from going public early (just as Internet start-ups did in the late 90s!). So it is a strange mix of features of hardware and software companies.

In a series of documents on the biotech history, I could find the following quote related to Genentech: “Late in 1979, Tom Perkins pushed the idea of a public offering. Although the technology was young, and we were early on in the development of products, there was enough interest in the public to get a public offering done. This was a foreign concept at the time. While we had a couple million dollars in revenue–! think it was $3.5 million in revenues in 1979-there were no product revenues or profits generated from products. Whether or not you could take a company public that didn t have product revenue, didn t have commercialized products, and didn t have significant profits, was an unknown. In the mid to late seventies, if companies went public, they had revenues and earnings. You d have at least $10 million in revenues and at least a million dollars in profit, then maybe you could have one of the small high-tech underwriters take you public.”

Secondly, the founders are seldom the typical nerds with some great business vision (Gates, Jobs, Brin/Page, Zuckerberg) but often university professors/researchers. They do not have to quit their academic position and often take the title of chief scientist. (This also happens in the hardware academic spin-offs, with Atheros as an example I mentioned in a recent post).

As a first illustration of all this, I will just show some data about Chiron. My next post will be about Genzyme and I will conclude with general elements in the 3rd and final post.

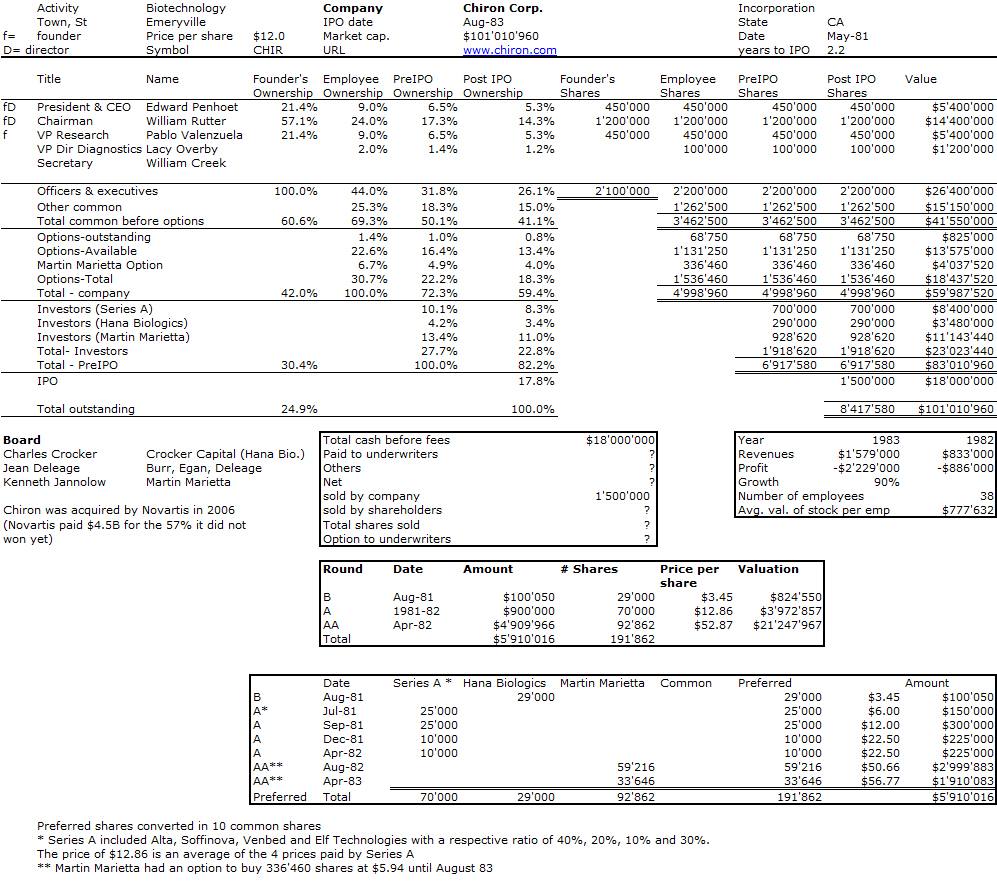
Chiron was one of the early start-ups in biotech. It was founded in August 1981 and went public in May 1983… 2.2 years! It had three founders Edward Penhoet, William Rutter and Pablo Valenzuela who were respectively 41, 54 and 40 years old when Chiron was founded. Not kids in their early twenties! Their activity at time of foundation was professor at Berkeley, professor at UCSF, researcher at UCSF.
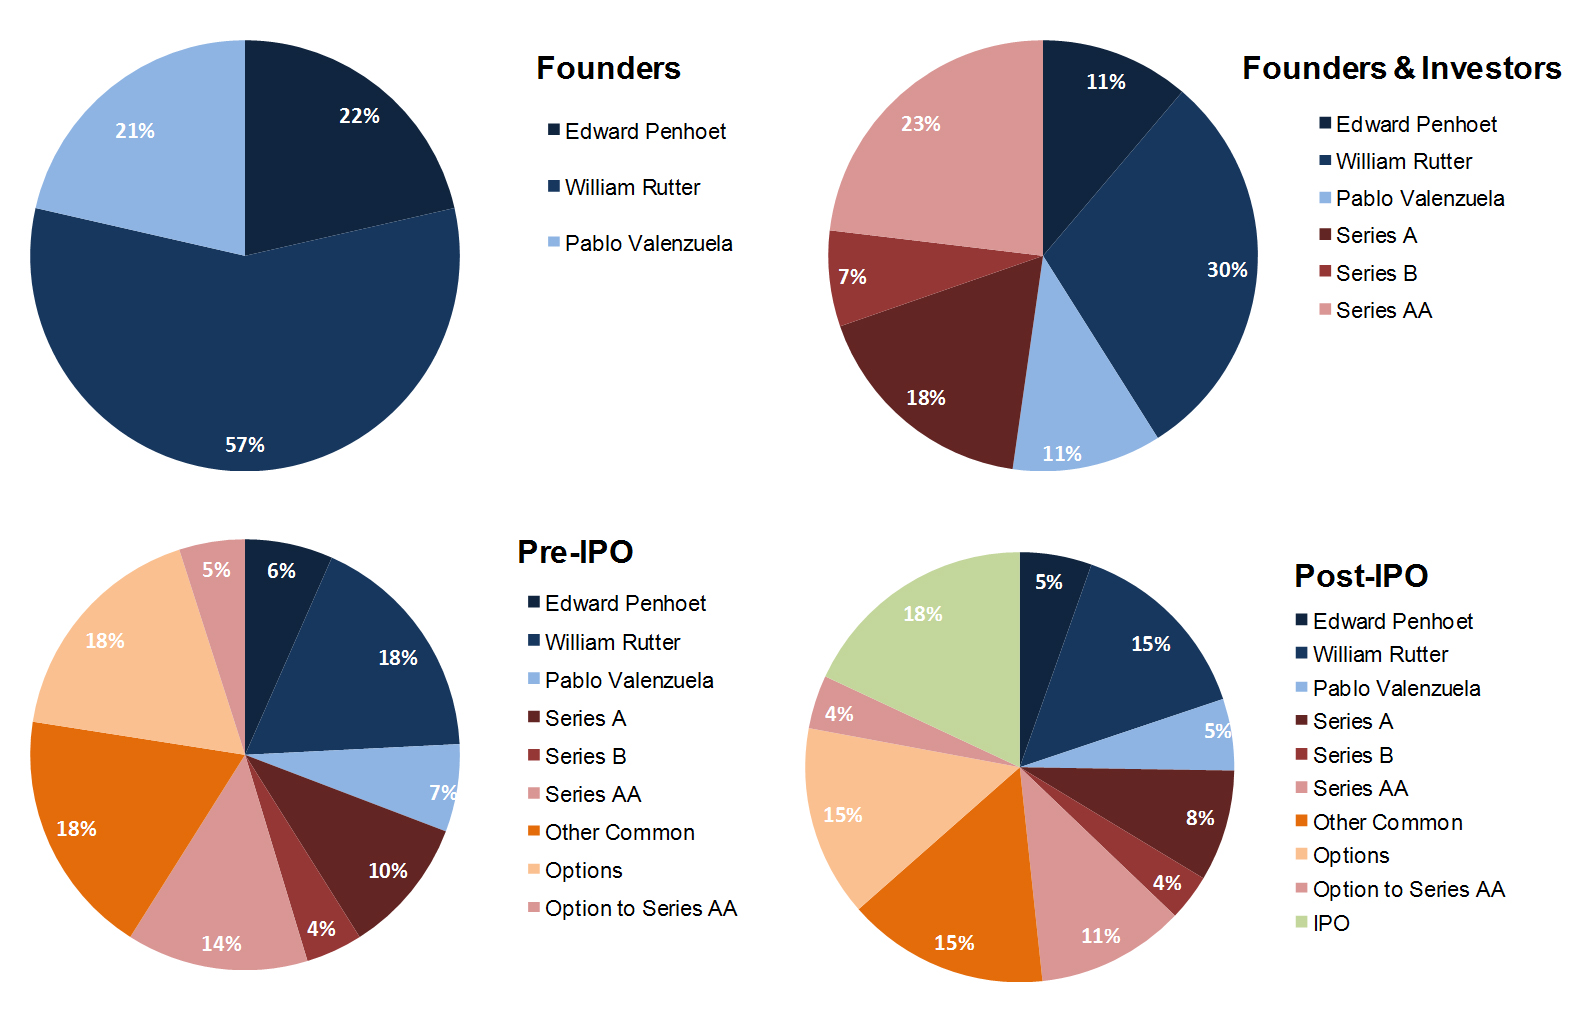
Here is my usual cap. table followed by the equity pie. Chiron at $1.5M and $0.8M in revenue in 1983 and 1982, there was no profit but a loss of $2.2M in 83 and $0.8M in 1982…

Chiron was bought in 2006 by Novartis and it is not the only biotech start-up acquired by an European corporation as we will see soon.

Next post: Genzyme.
If Twitter was going public, some far-fetched assumptions

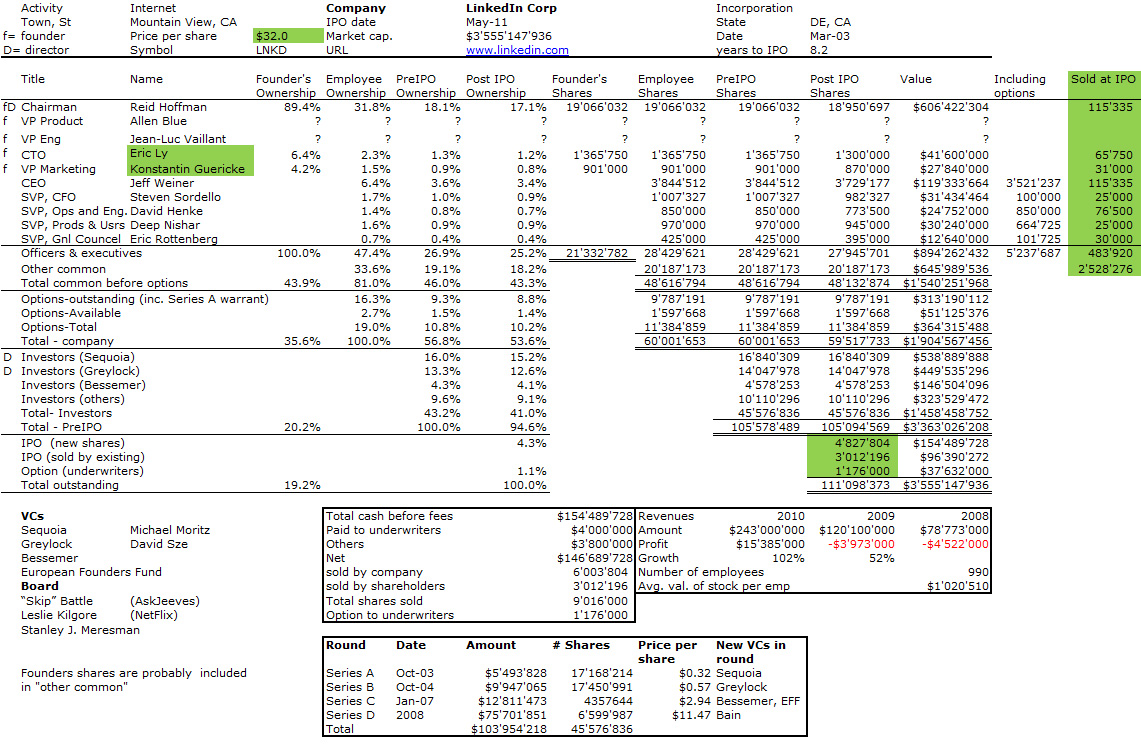
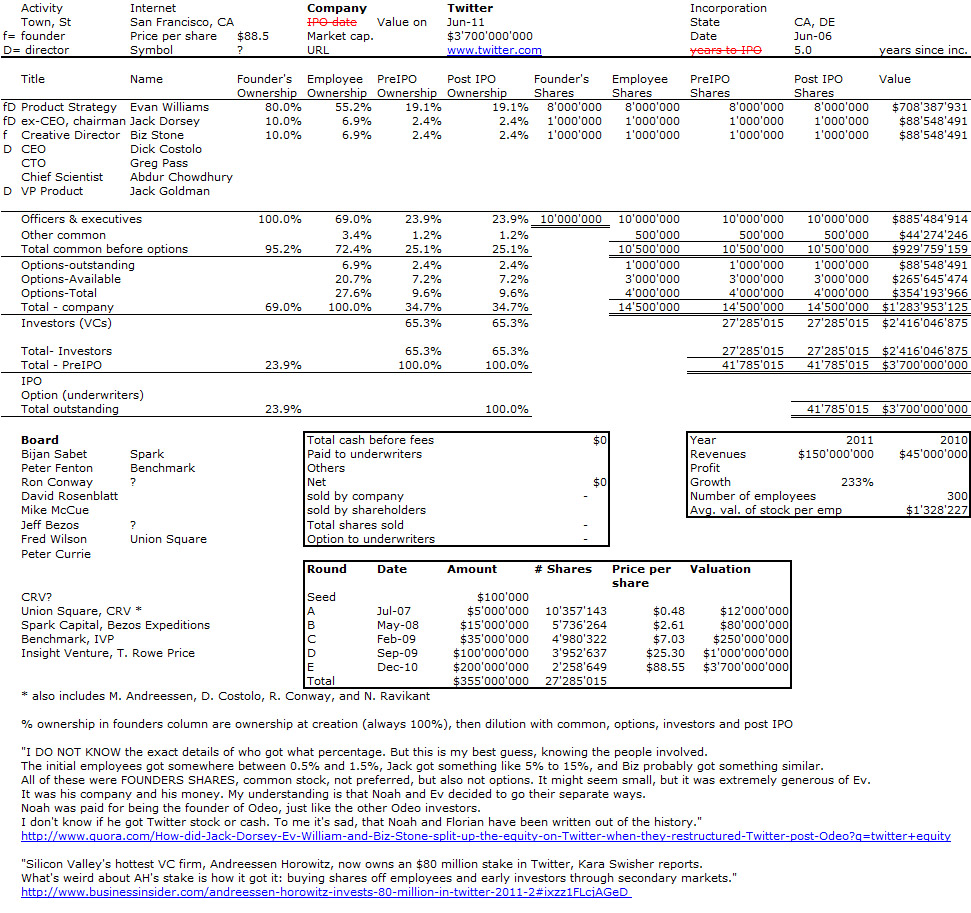
Twitter is with Facebook, Groupon and LinkedIn, one of the divas if the web 2.0. This morning, I read about a new rumor that the start-up received a new investment valuing Twitter at $4.5B. Twitter has already raised more than $250M and the latest valuation was $3.7B for only $45M in revenues in 2010 with 300 employees. If this is true, Evan Williams, Jack Dorsey et Biz Stone, the 3 founders, are already wealthy, all the more that it seems that some of the investors did not buy new shares from the company, but existing shares from management and employees.

I tried to read the crystal ball and guess how the shareholding is structured. Given the number of unknown parameters, I am probably quite far from the current status, but, thanks to a simple analysis of the financing rounds, a standard stock option plan and a quora article on the founders, here is the result:

Check Point, the Israel success story

After my recent posts about Israel and high-tech innovation, I discovered I did know not very well the Check Point story. Start-up Nation did not provide much info and though you can find a lot on Wikipedia or on the Facts@Glance of the company. for example, I became a little frustrated when I discovered I could not find much about the company early days and IPO. I even had to buy the IPO filing through the SEC as the document is not public on the web and Check Point could not help me with such info.

There are a couple of very interesting points:
– the three founders had equal shareholding at foundation (and afer Check Point went public).
– Gil Shwed, one of the co-founders, is still the chairman and CEO. Another unexperienced and young entrepreneur who grew his baby through adulthood.
– Many women in the management of the company, Deborah Triant at the time of IPO, but even today Dorit Dor, Tal Payne and Juliette Sultan as the executive team page shows. (This may have to be linked to Israel culture again).


Gil Schwed, Shlomo Kramer ,Marius Nacht, the 3 co-founders and
Deborah Triant (from the early web sites of Check Point)

Now the usual cap. table that I could build from the IPO filing and the shareholding pies at the end of the post.

– What is interesting is that Check Point did not raise a lot of money, mostly $600k from BRM in 1993. There were also some loans ($400k) and R&D ($160k) from BRM also which do not appear in the shareholding.
– The American VCs (Venrock and USVP) bought shares from BRM in a secondary financing, so there was no new money for Check Point.
– Check Point issued 3M new shares at IPO and existing shareholders (BRM and the 3 co-founders) sold 1.2M shares.
– Not the least impressive, it took the company 3 years only to go public and its 1995 and 1996 numbers are already impressive.

As usual, I hope this does not include too many inaccuracies or mistakes…

When a cap. table is a nightmare!

As I wrote recently, IPO filing is accelerating (just check my recent post on LinkedIn and Pandora). Maybe, it should not be so much. Too much may mean a speculative bubble A recent one is Active Network. I tried to build the cap. table. Piece of cake, usually, even if I am sure, they have some mistakes. And I was lucky, Active had filed but failed in 2004 (a sign?), so I also have the 2004 cap. table. But it was a nightmare. I could not find anything about the founders, not much about how much the company really raised, even if I have full disclosure on liquidation preference.

So here is first the 2004 cap. table (once again I must mention that information given is subject to possibly many inaccuracies)

And here is the 2011 new table.

Not very sexy, not to say awful! I do not talk only about the pictures themselves that you can download and enlarge, but also about the messiness of the structure! But still interesting…