
Sixth post of comments on the 600 startup data. Today, it’s about the valuation of startups.
I had touched the topic on page 615 of the pdf. Here is the data again.
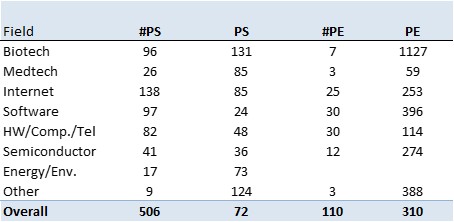
Be aware that these numbers are not typical of traditionnal companies. They show that startups going public are of a speculative nature, with a promise of very high-growth in the future. The multiples are very high and in the case of earnings, in fact most startups do not make a profit at IPO – about one out five!
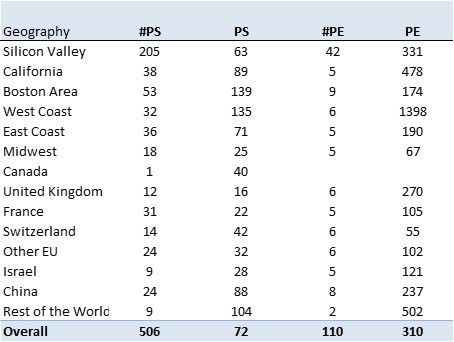
Interestingly Silicon Valley does not have the highest multiples, but Europe is behing the USA.
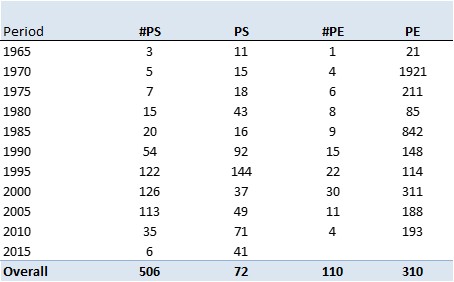
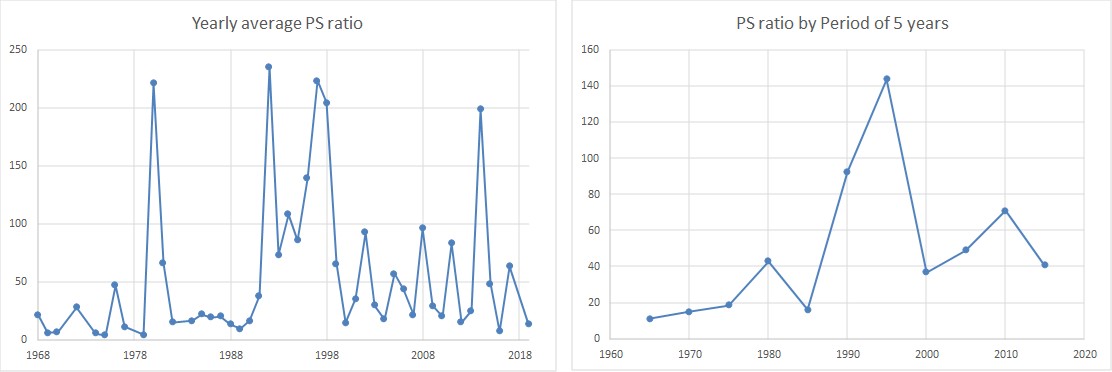
The tables give the PS ratio (price to sales – ratio between valuation and sales) and PE ratio (price to earnings – ratio between valuation and profits) and the number of startups taken into account each time. The following curves show the PS values by 5-year periods and by year.
If you are lost, here are slides I have used in the past and if you want to get the excel file, send me an email.
Dear Herve,
Tried to get the PDF from your last batch of the 600’s but can’t get the link.
Could you please indicate it to me.
Thanks a lot, and by the way great job with those statistics.
Kindest regards,
JC Wehrle
It could be you need to have a scibd account but the direct link is
https://www.scribd.com/document/455250191/Equity-in-600-Startups-by-Herve-Lebret-published-in-April-2020