I recently read an article mentioning a new report by Index Ventures Rémunération du risque : la France s’en sort bien ! and a few days later a student of mine mentioned a new app by Index to help entrepreneurs allocate stock options: Index Ventures Option Plan beta. Thanks Javier! I had a look, tweeted about it and then thought it was worth a blog article…
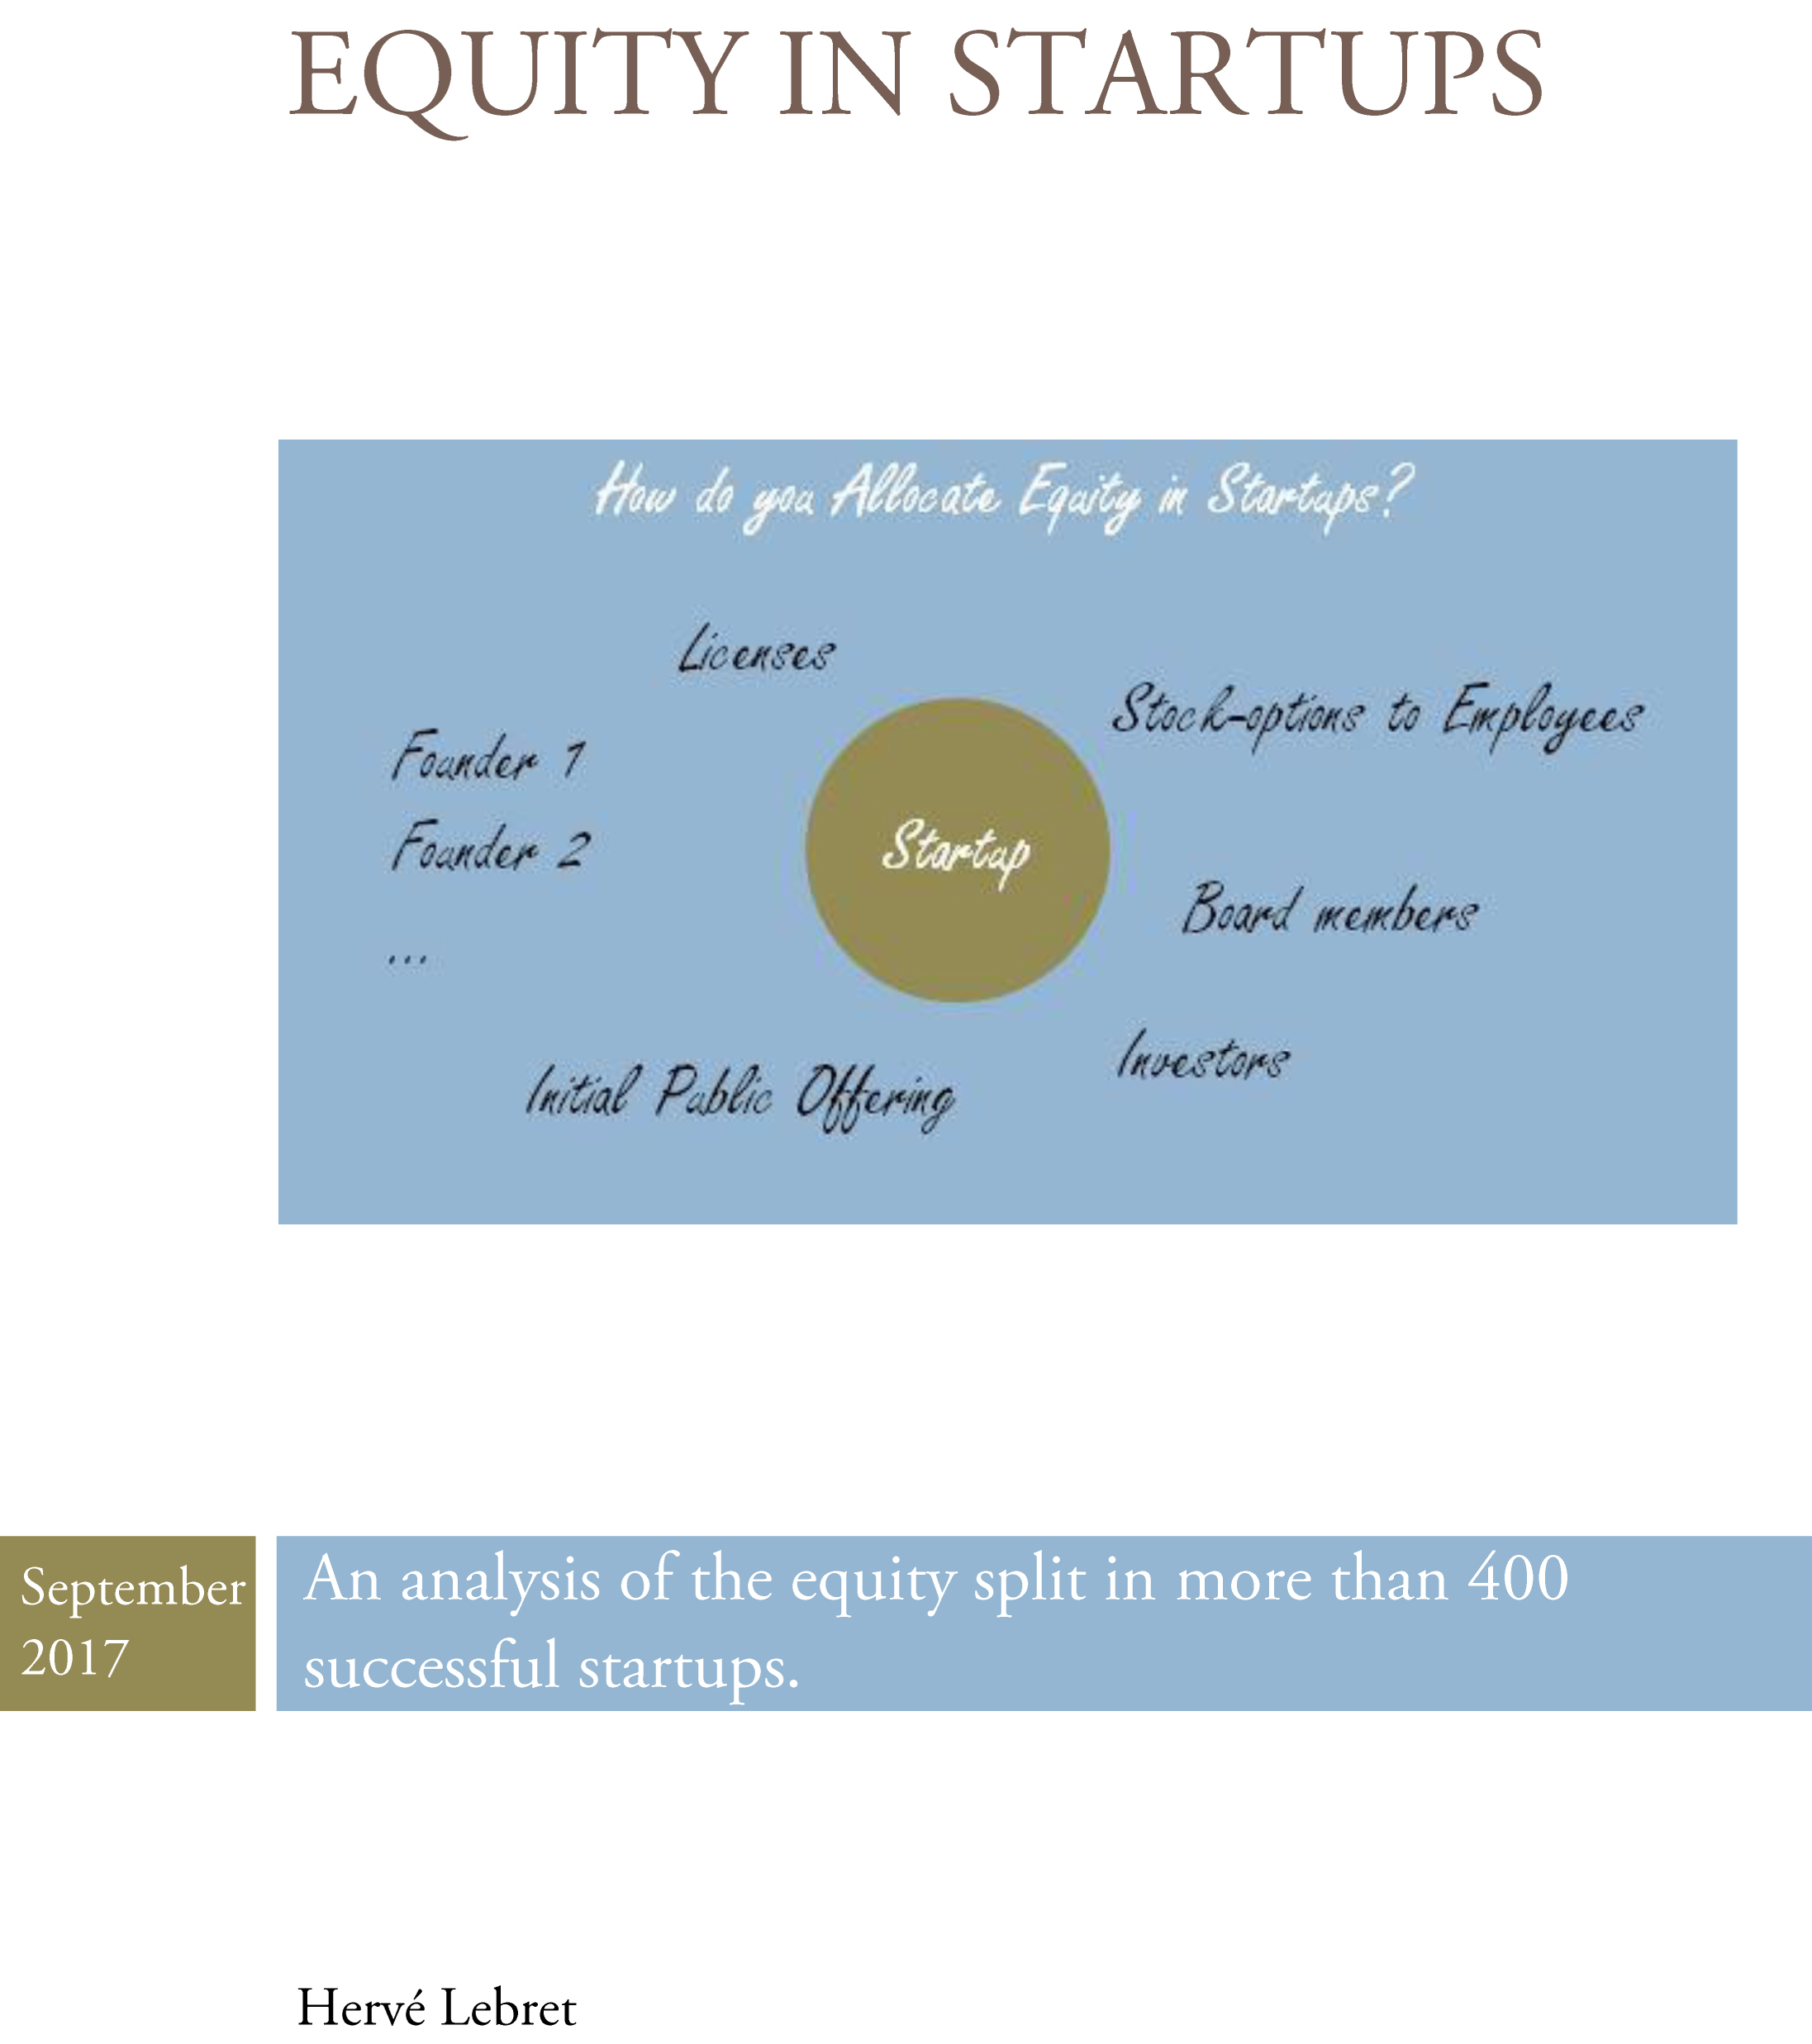
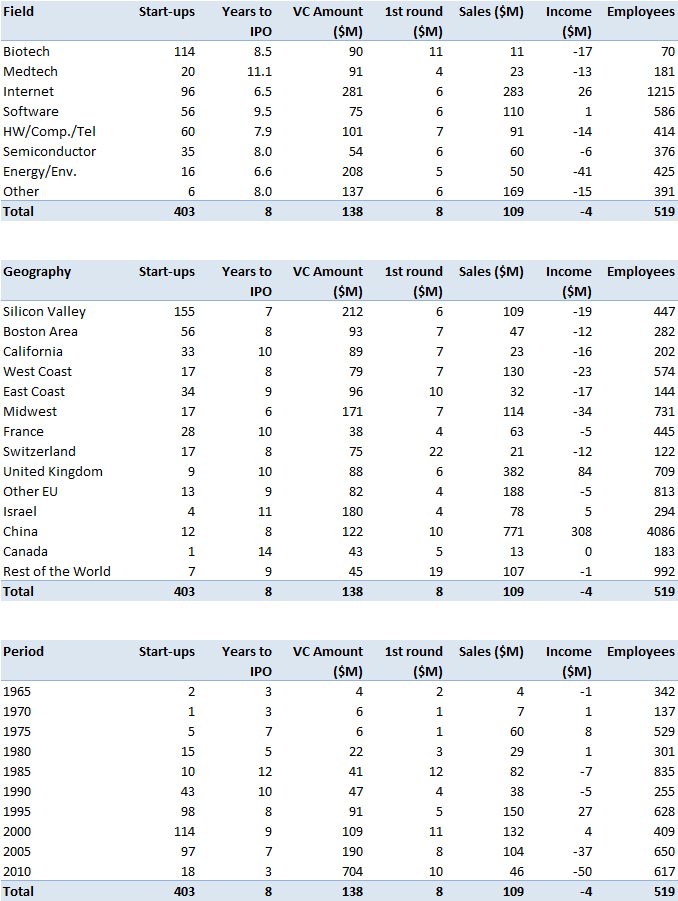
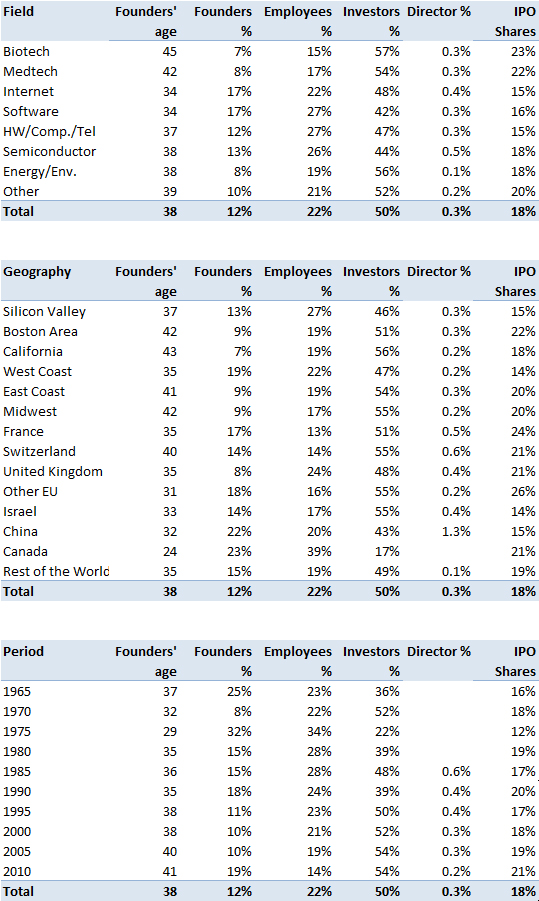
I advise you to read the full (143-page) report – link here. It includes great information at the macro (national policy) and micro (startup) level. There are minor differences with my past analyses such Equity in Startups published in Sept. 2017 or my recurrent class about Equity Split in Startups which you can find here:
What is particularly interesting, I think, is their summary:
1 European employees own less of the companies they work for than US employees. For late-stage startups, they own around 10%, versus 20% in the US.
2 Ownership levels vary much more in Europe than the US. In Europe, employee ownership in late-stage startups ranges from 4% to 20%. In the US, ownership is more consistent, as stock option allocation is driven by market forces.
3 Employee ownership correlates to how deeply technical a startup is. An AI or enterprise software startup requires more technical know-how than a straightforward e-commerce startup. These employees are more likely to seek stock options.
4 Ownership policy details adopted by startups vary between the US and Europe. For example, provisions for leavers, and accelerated vesting following a change in control.
5 In Europe, stock options are executive-biased. Two-thirds of stock options are allocated to executives, and one third to employees below executive level. In the US, it’s the reverse.
6 European employees still don’t expect stock options much of the time. US employees joining a tech startup with fewer than 100 staff would typically expect stock options straight away. This is much less true in Europe, although expectations are steadily rising.
7 European option holders are often disadvantaged. In much of Europe, employees will be paying a high strike price, and they will be taxed heavily upon exercise as well as sale. Leavers often get nothing.
8 There is wide variation in national policy across Europe, with the UK most supportive of employee ownership. Regulations and tax frameworks are radically different across Europe. The UK’s EMI scheme is most favourable, better than what is available in the US, and France is also good. Other countries, including Germany, lag behind in our opinion.