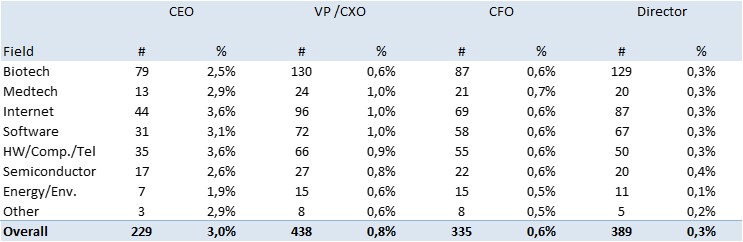
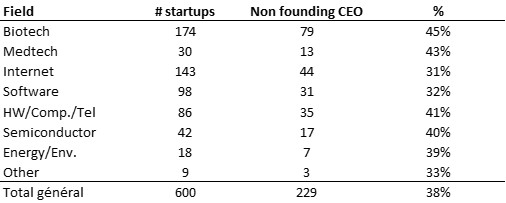
Fifth post of comments on the 600 startup data. Today, it’s about the ownership of non-founding CEOs (compared to the founders).
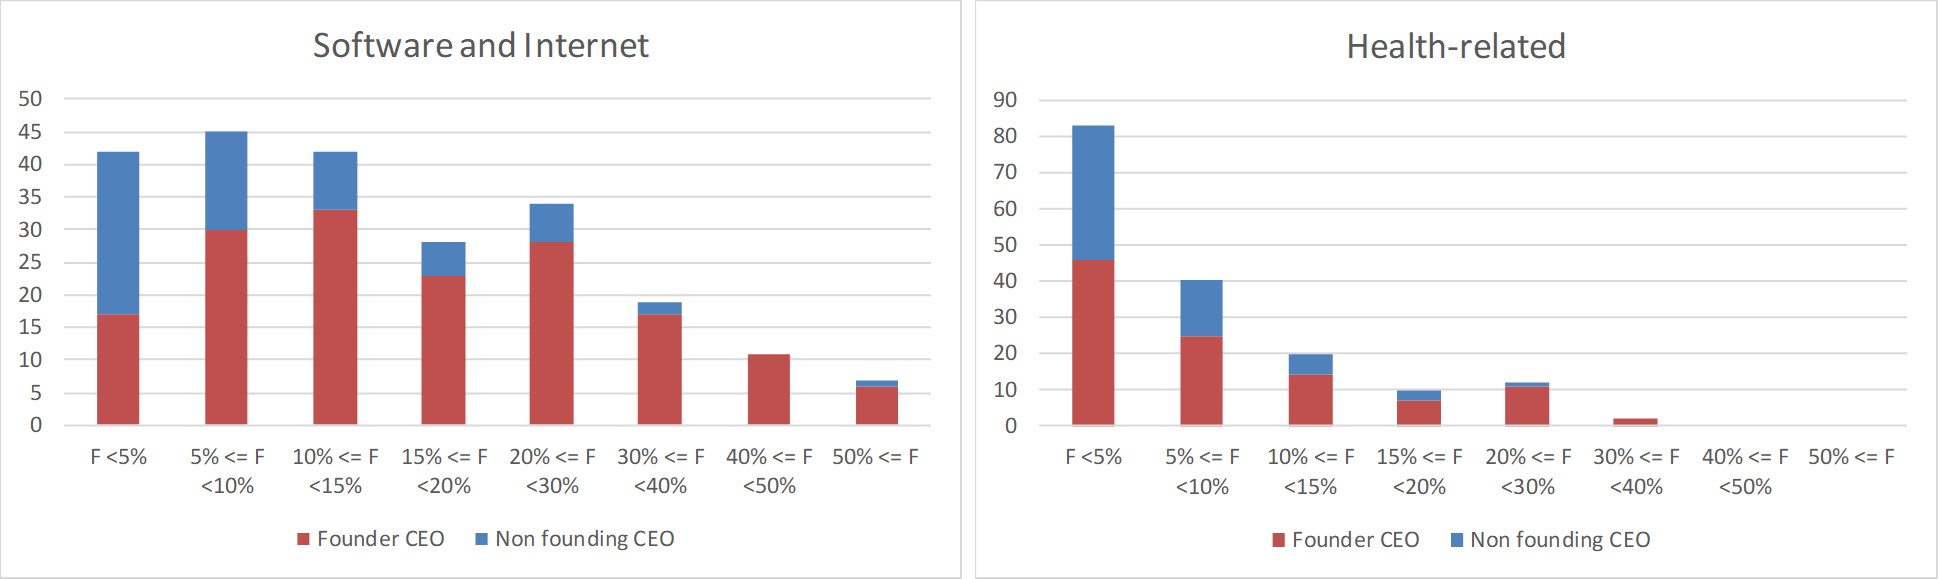
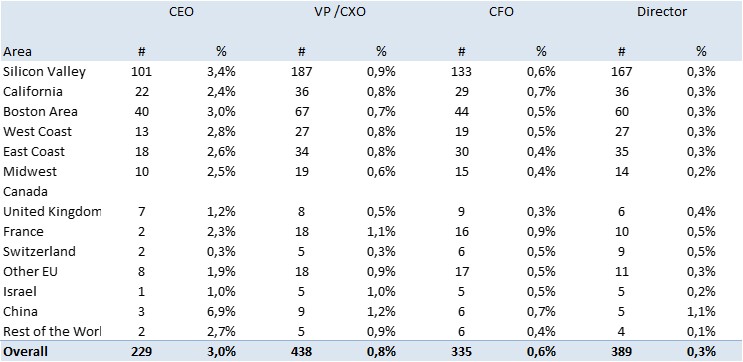
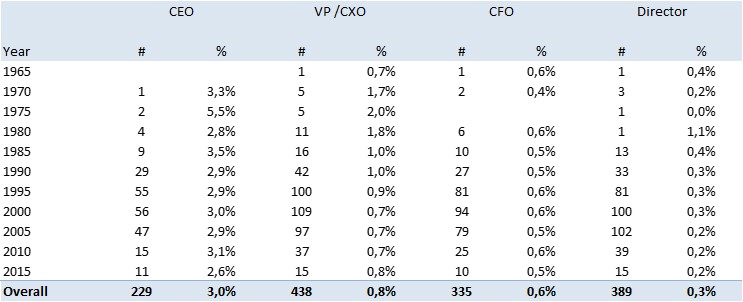
I noticed a few months ago that in a majority of cases, the CEO was a founder. This was a surprise. The data confirms this: there are a total of 229 startups with a non-founding CEO out of 600 (38%). Again, fewer in the digital domain, and more in the health-related fields.
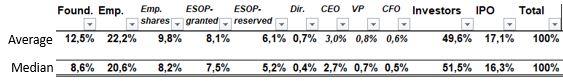
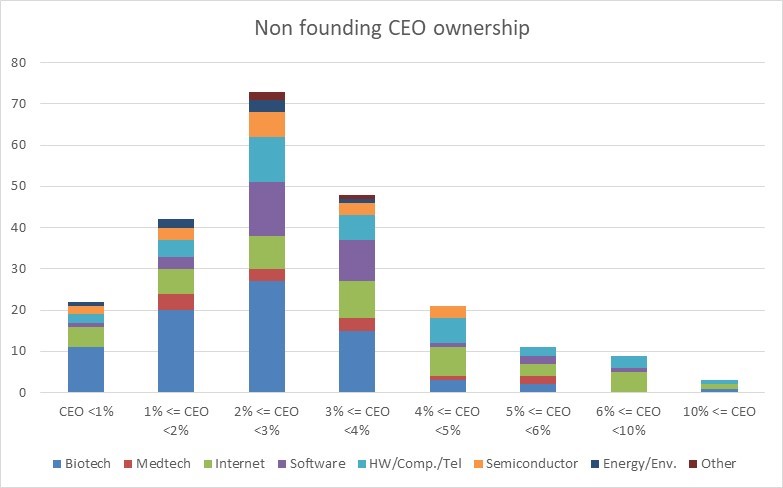
As you may see in my initial post, these CEOS have on average a 3% ownership (median value is 2.7%).
Is all this useful in practice? The median value of the ratio between the CEO & founders’s ownership is 0,5 (the average value is 1 because there are big outliers). Does this mean that if founders want to hire a CEO at foundation, he should have about 33% of the company, and at series A about 15% if you have read all my posts before!
Here is a more granular illustration.
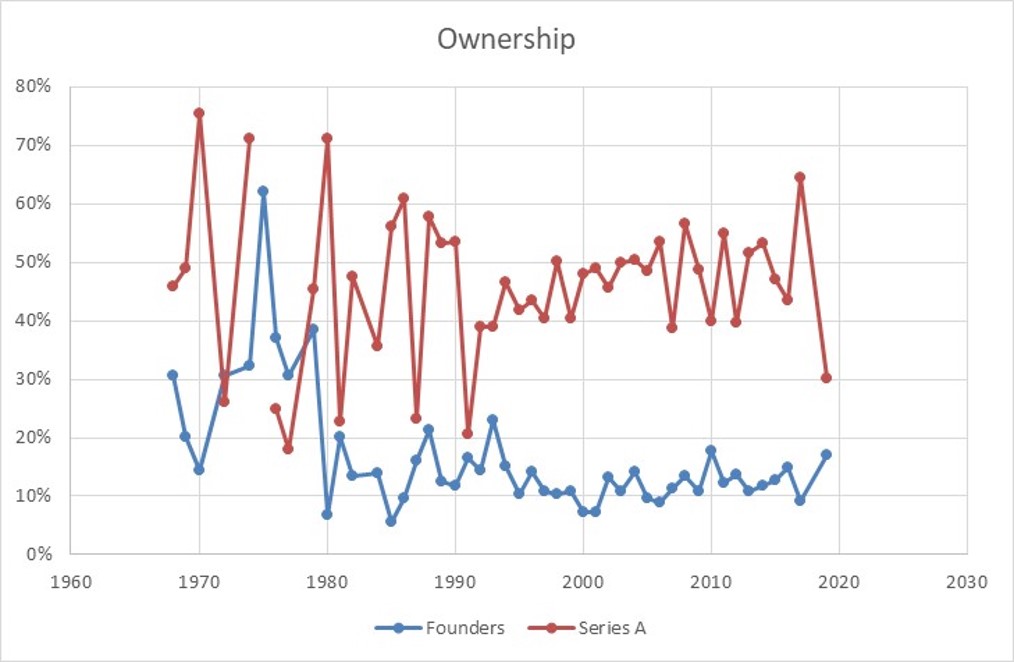
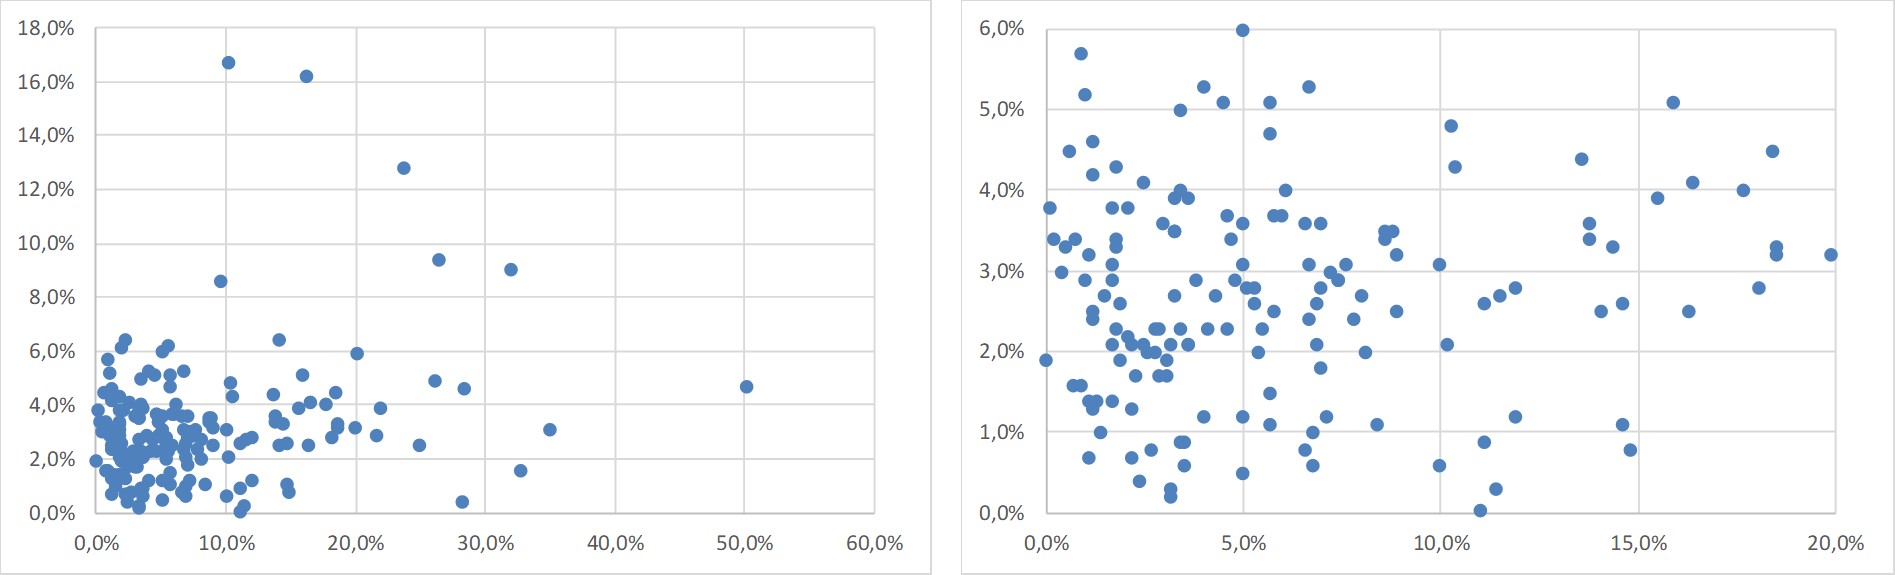
The next image shows the founders’ ownership on the horizontal axis vs. the CEO’s on the vertical axis (with a zoom on the right).
A final illustration as food for thought, the founders’ ownership in the digital and health-related fields, relatively to the presence of a non-founding CEO or not. (Note that the vertical axis does not have the same scale for the two domains).