As an interesting coincidence, I was mentioned twice in a few days a recent research about the age of founders:
– Colleagues from IMF – the International Monetary Fund – mentioned to me this morning an article from The Harvard Business Review published in 2018: Research: The Average Age of a Successful Startup Founder Is 45 by Pierre Azoulay, Benjamin F. Jones, J. Daniel Kim, and Javier Miranda.
– Just before Christmas, I had a debate with French economists about the age of founders, and they mentioned to me Age and High-Growth Entrepreneurship by Pierre Azoulay, Benjamin F. Jones, J. Daniel Kim, and Javier Miranda.
The same authors, the same messages… In a nutshell: “It’s widely believed that the most successful entrepreneurs are young. Bill Gates, Steve Jobs, and Mark Zuckerberg were in their early twenties when they launched what would become world-changing companies. Do these famous cases reflect a generalizable pattern? […] Our team analyzed the age of all business founders in the U.S. in recent years by leveraging confidential administrative data sets from the U.S. Census Bureau. We found that the average age of entrepreneurs at the time they founded their companies is 42. […] But what about the most successful startups? Is it possible that companies started by younger entrepreneurs are particularly successful? Among the top 0.1% of startups based on growth in their first five years, we find that the founders started their companies, on average, when they were 45 years old. […] These averages, however, hide a large amount of variation across industries. In software startups, the average age is 40, and younger founders aren’t uncommon. However, young people are less common in other industries such as oil and gas or biotechnology, where the average age is closer to 47. […] In light of this evidence, why do some VCs persist in betting on young founders? We cannot definitively answer this question with the data at our disposal, but we believe that two mechanisms could be at play. First, many VCs may operate under a mistaken belief that youth is the elixir of successful entrepreneurship — in other words, VCs are simply wrong. Though it is tempting to see age bias as the leading explanation for the divergence between our findings and investor behavior, there is a more benign possibility: VCs are not simply looking to identify the firms with the highest growth potential. Rather, they may seek investments that will yield the highest returns, and it is possible that young founders are more financially constrained than more experienced ones, leading them to cede upside to investors at a lower price. In other words, younger entrepreneurs may be a better “deal” for investors than more experienced founders.”
The age of founders has been an interesting topic here as you may check with tag #age. In particular I wrote
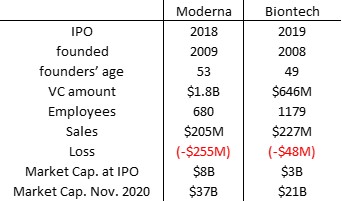
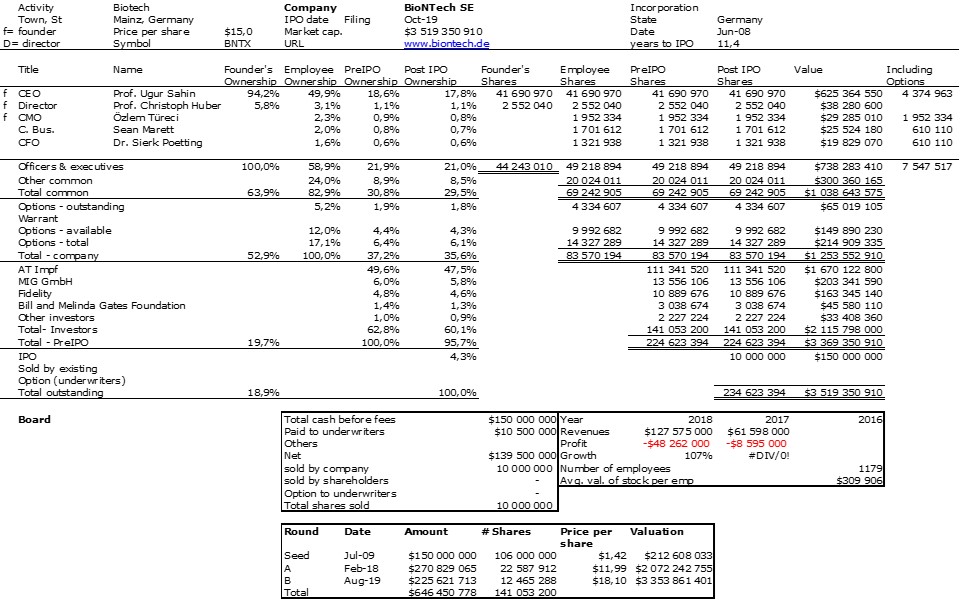
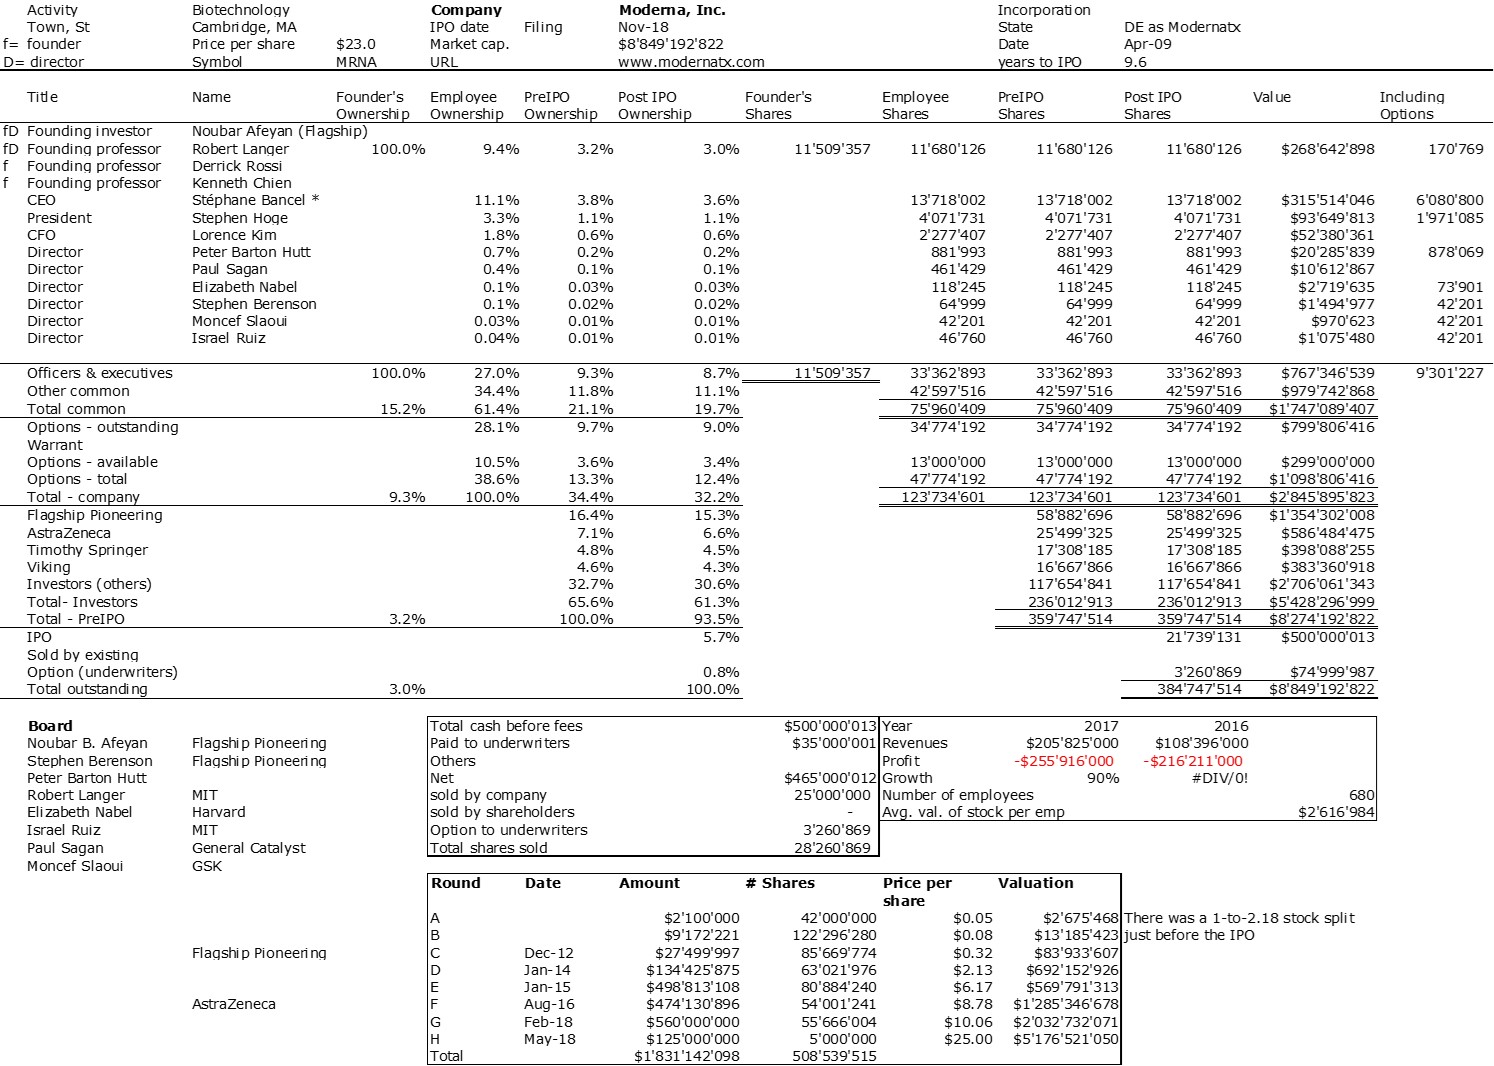
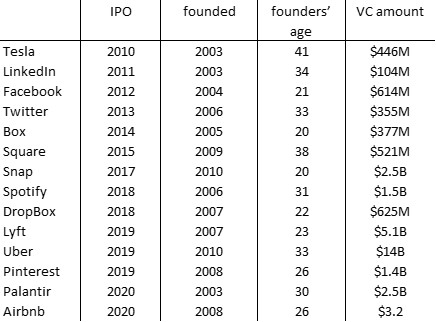
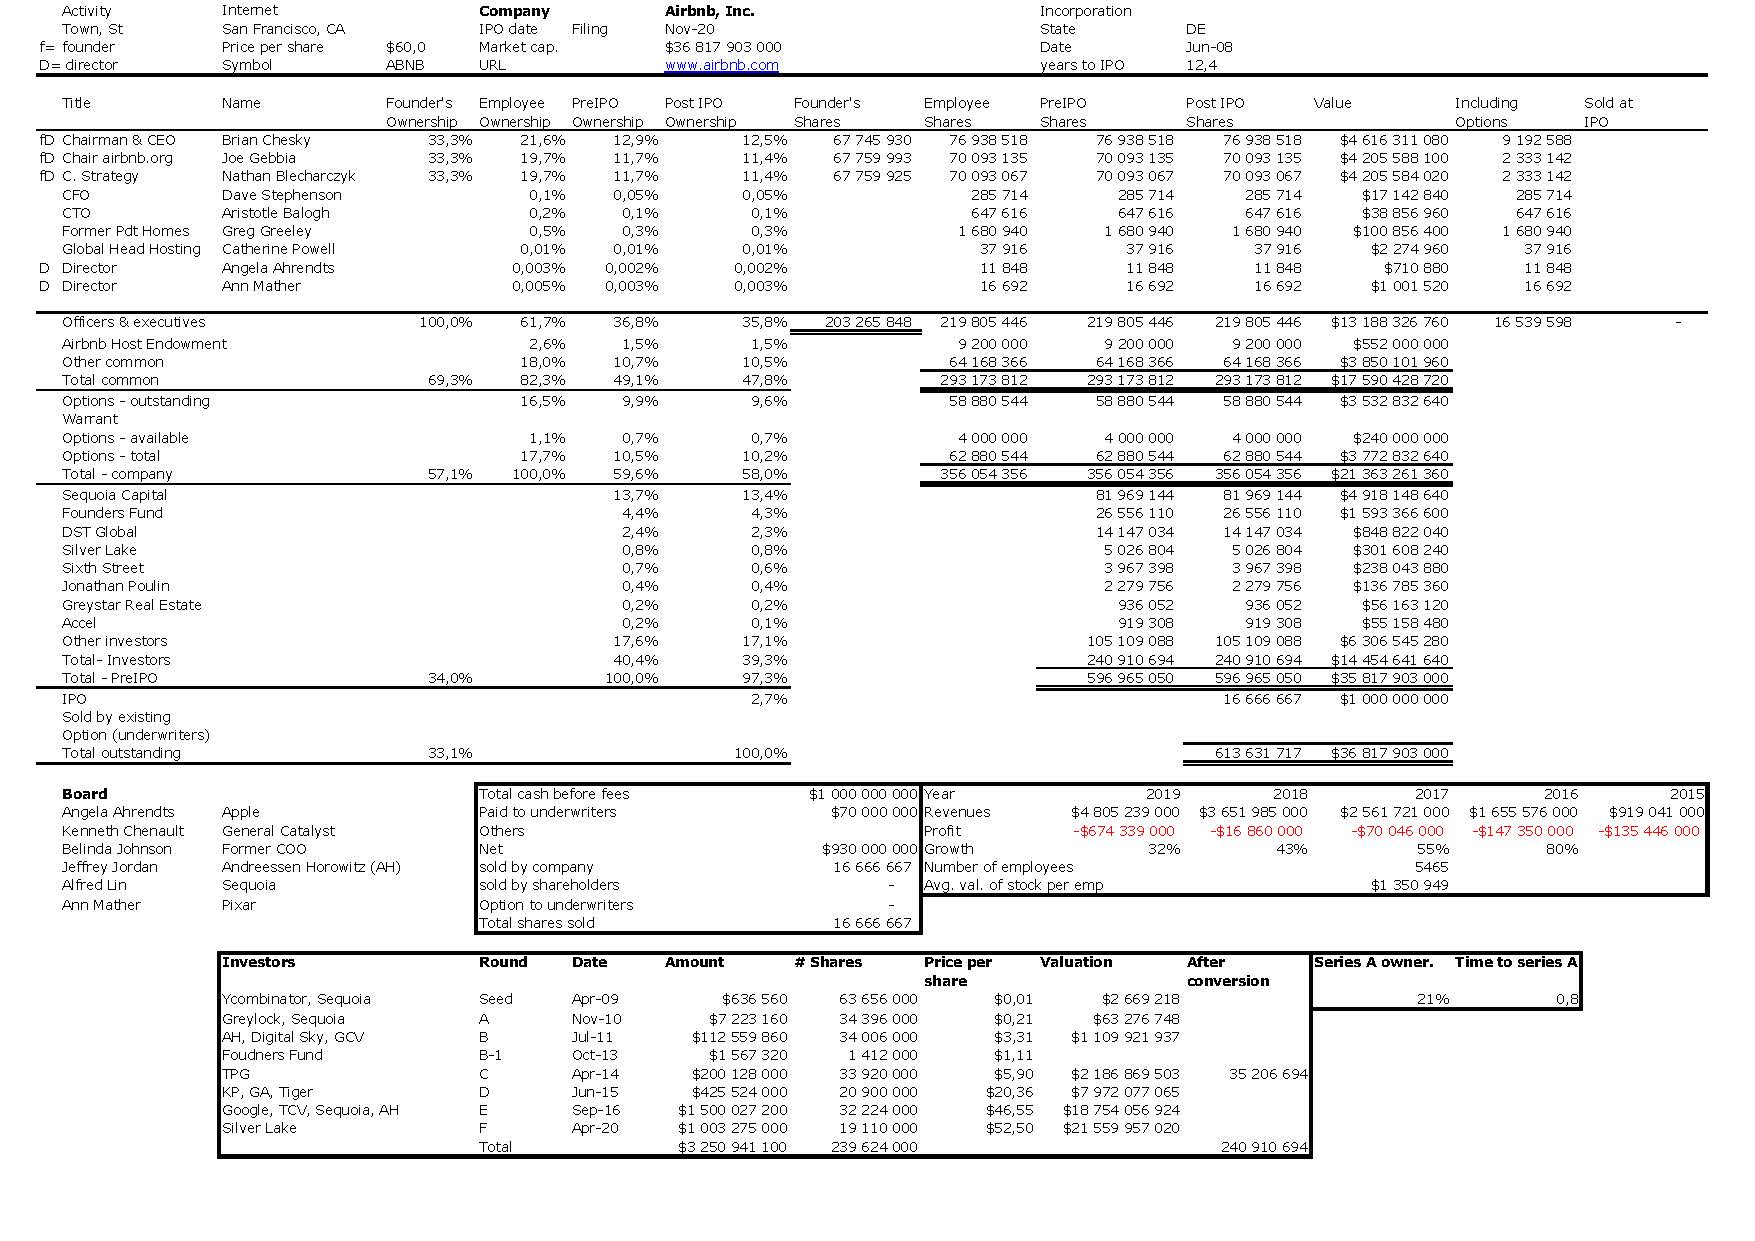
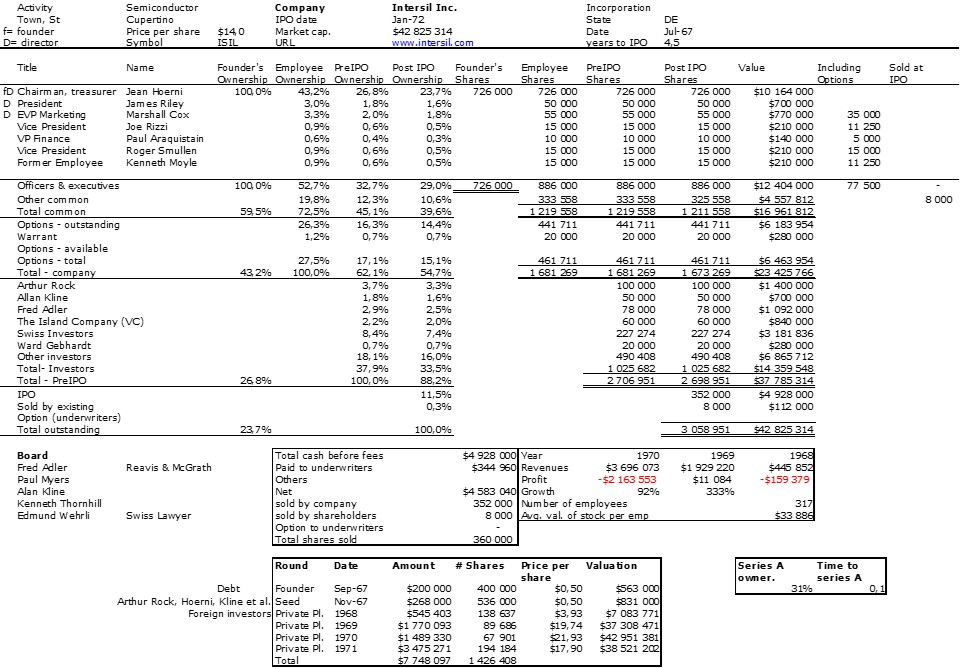
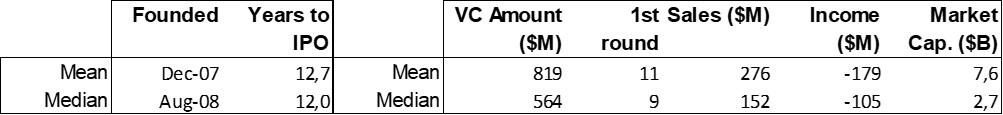
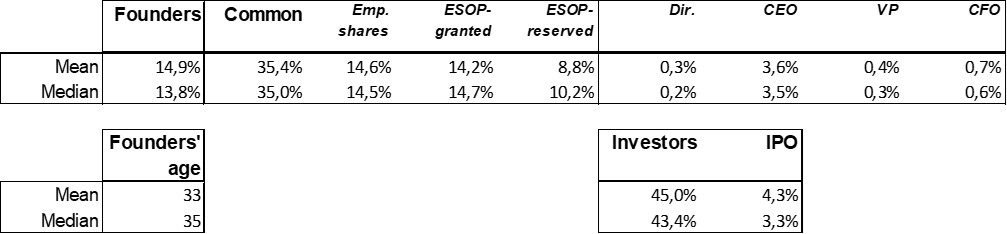
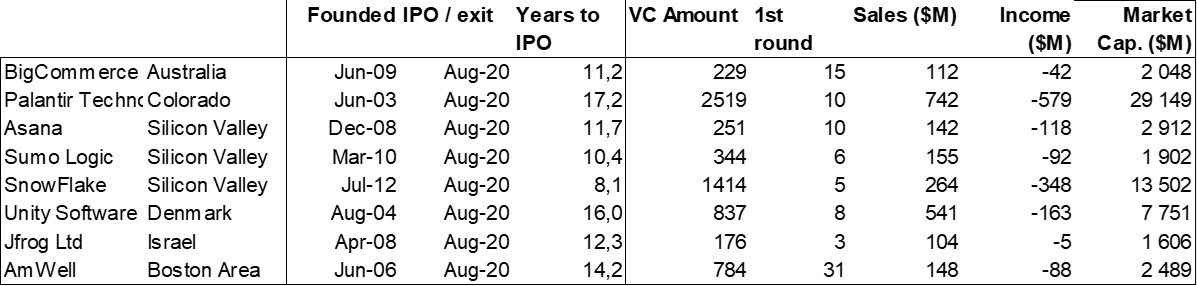
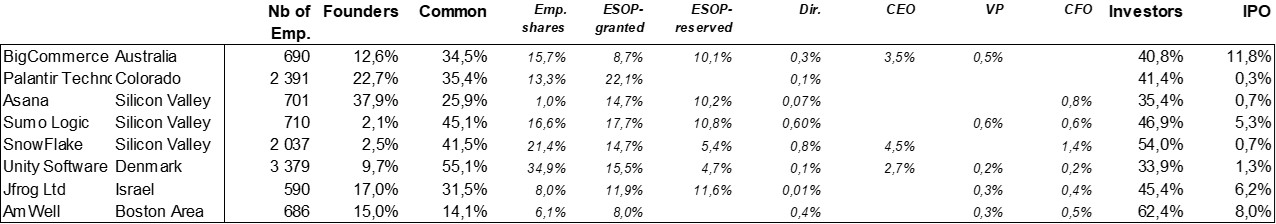
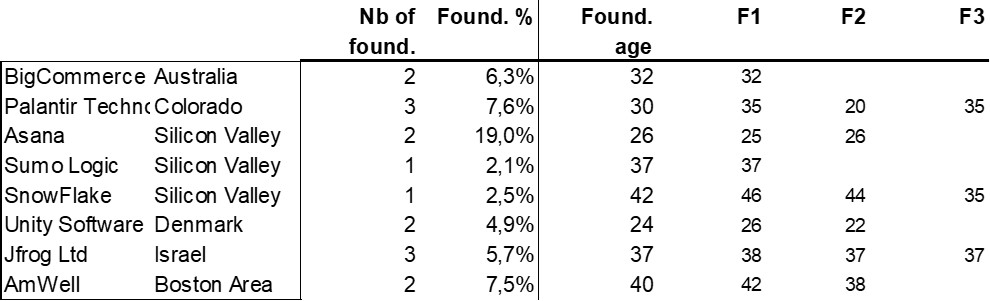
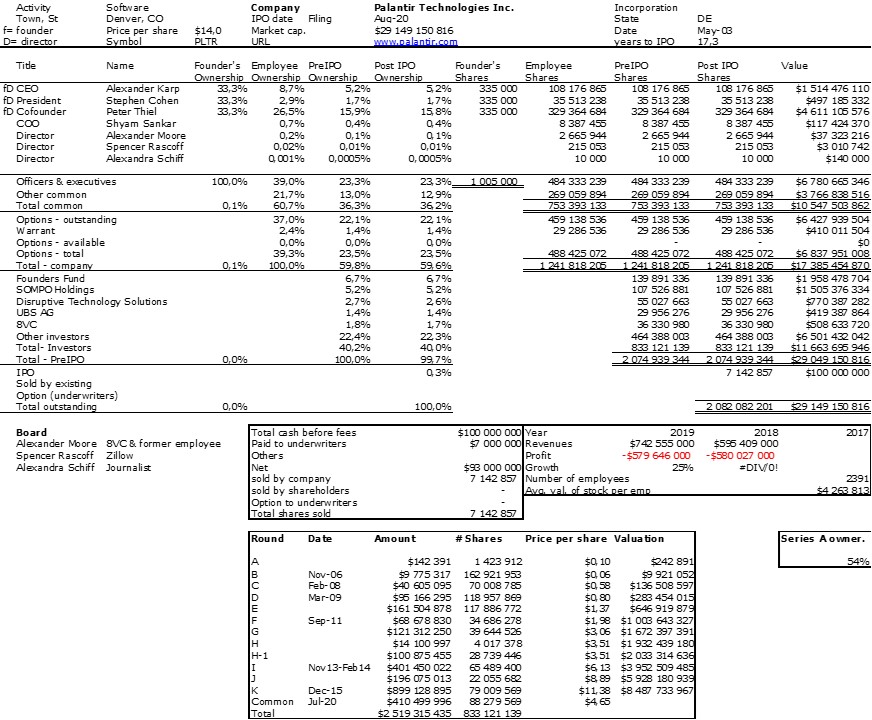
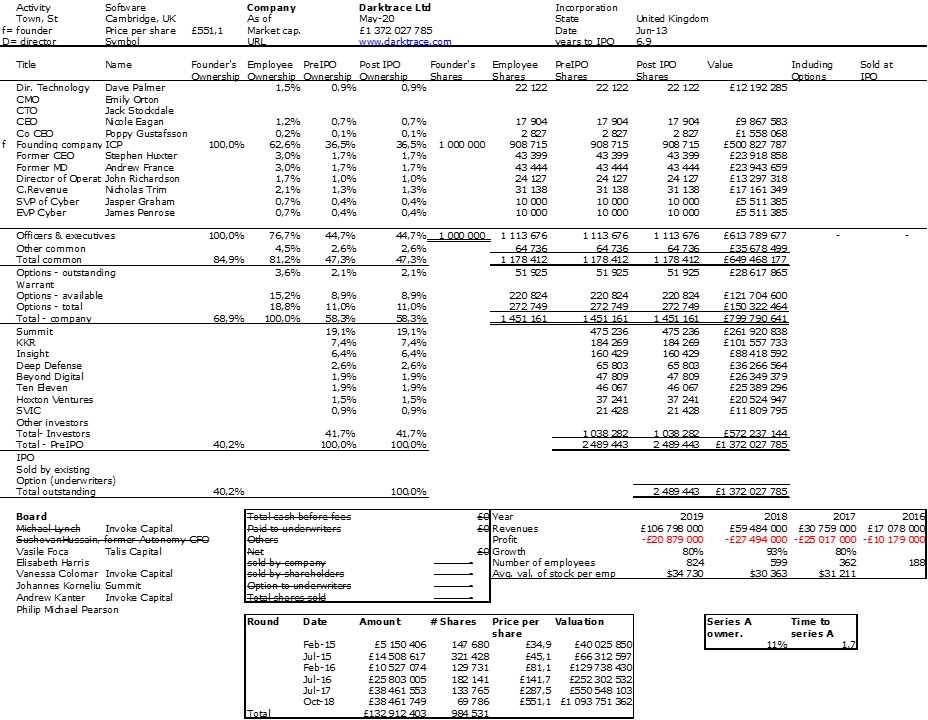
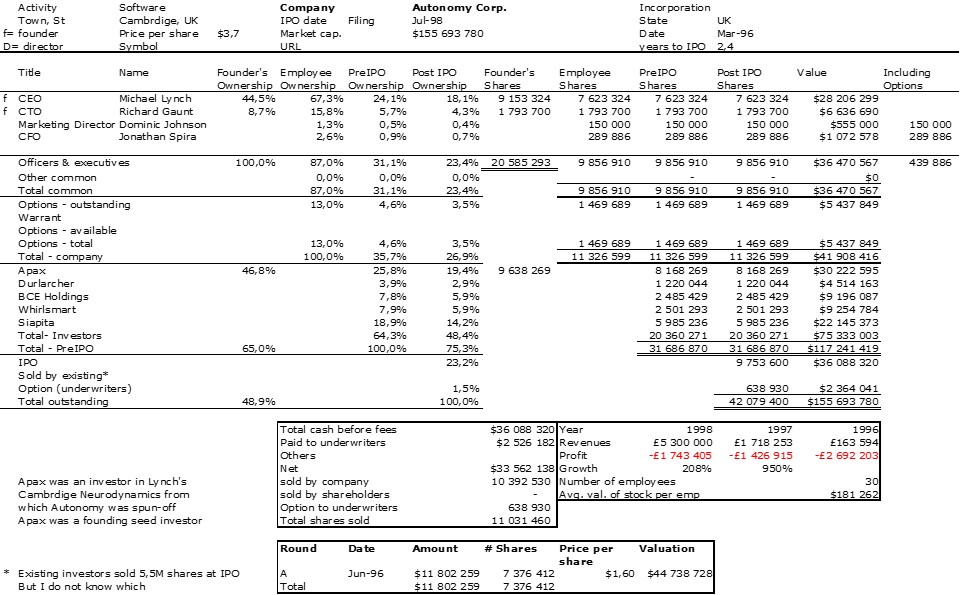
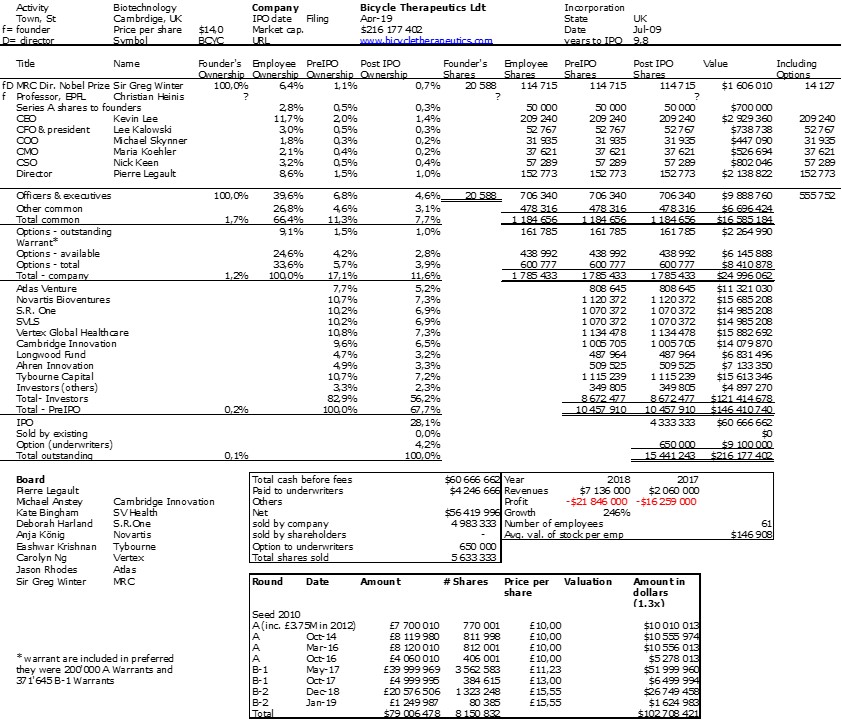
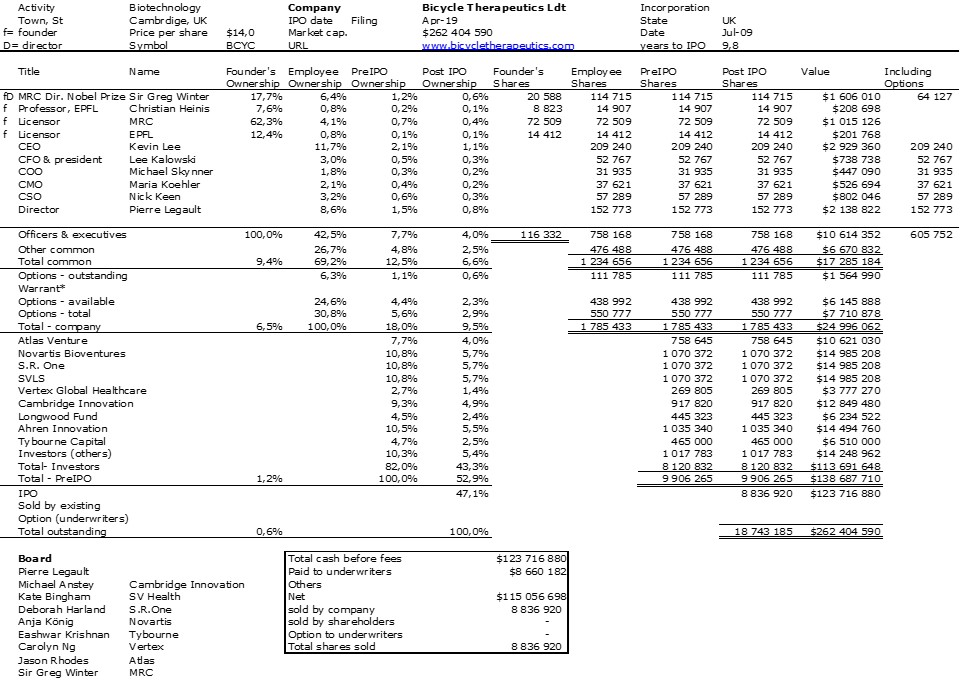
– Data about equity of 600 startups in April 2020
– The Age of Founders of Start-ups – Again! in April 2019
– Age and Experience of High-tech Entrepreneurs in June 2014
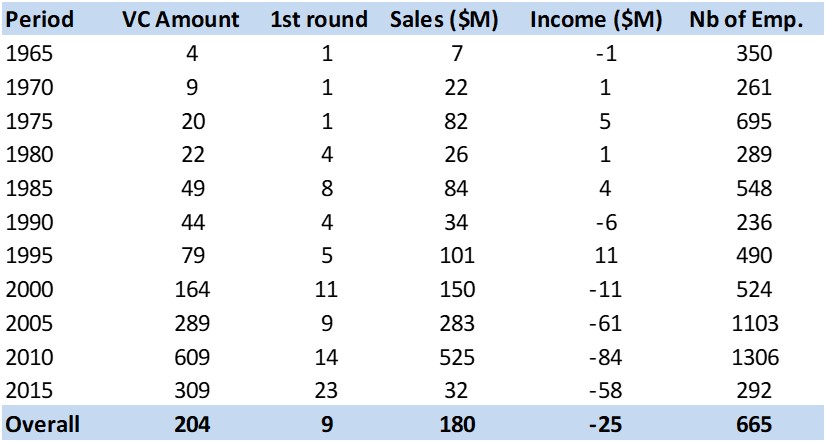
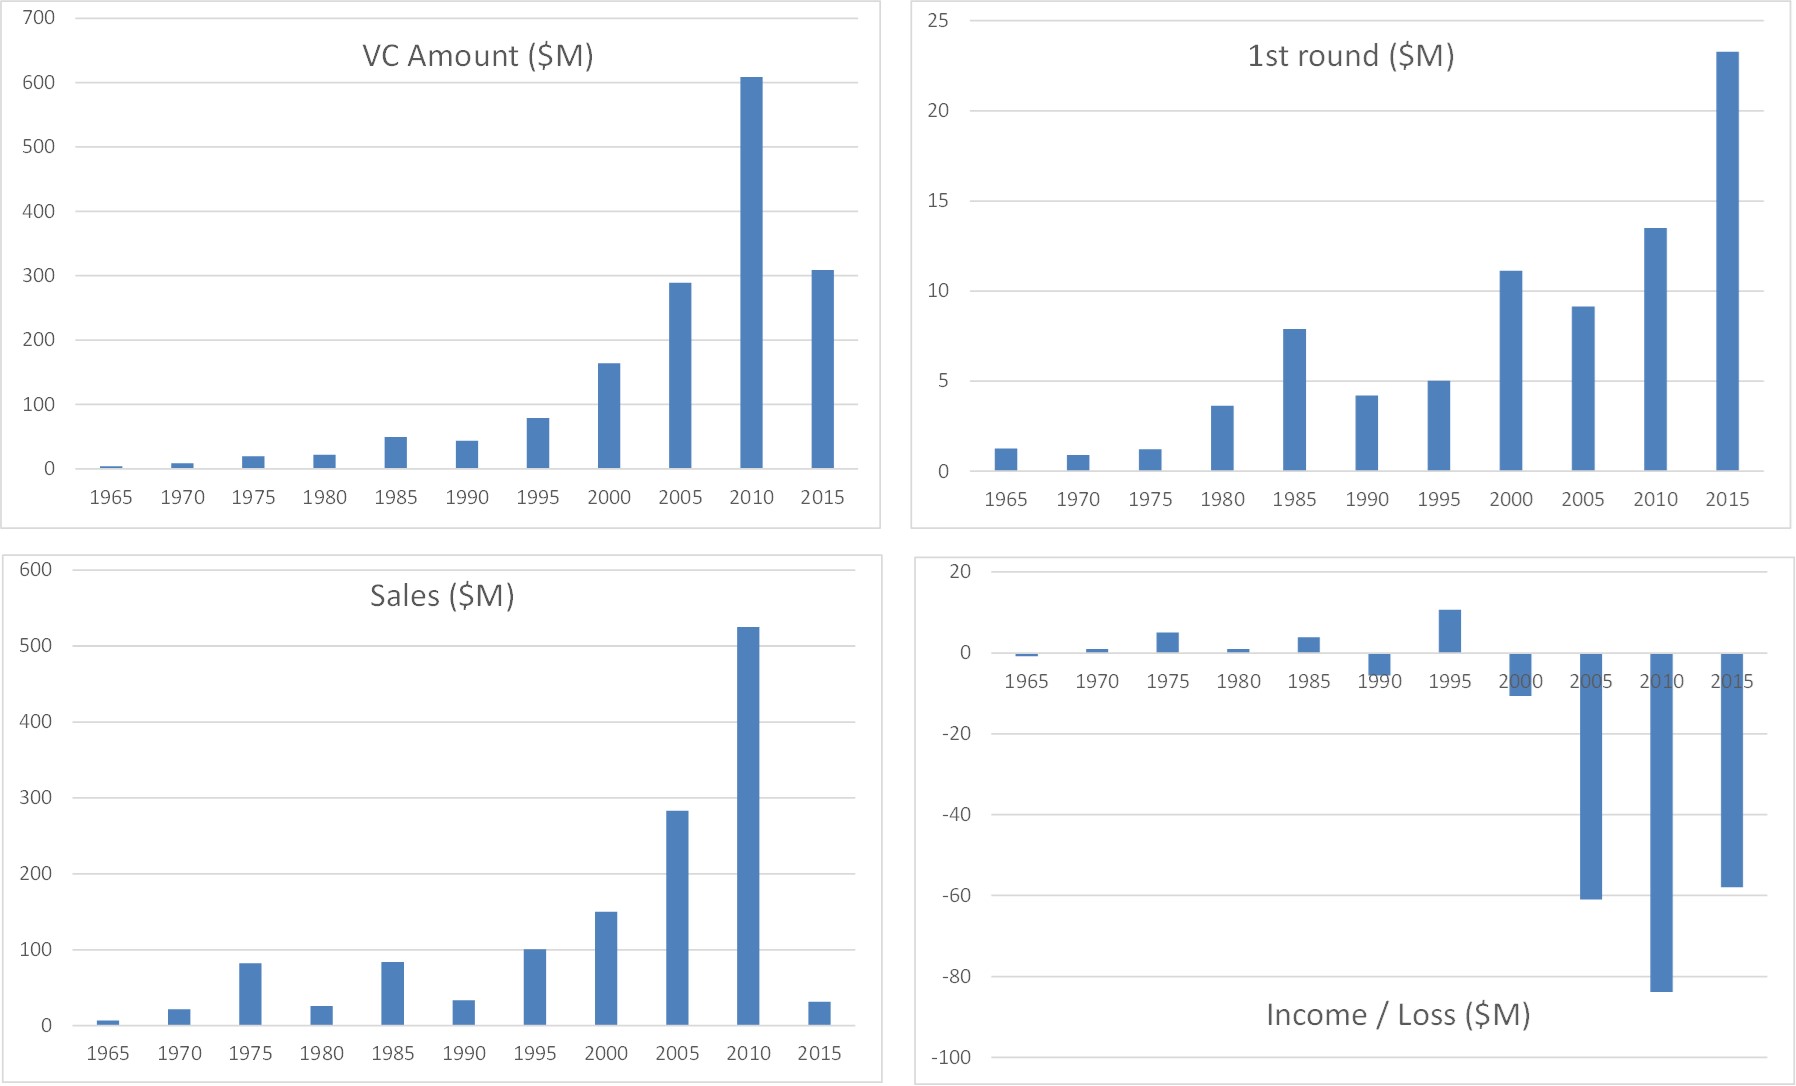
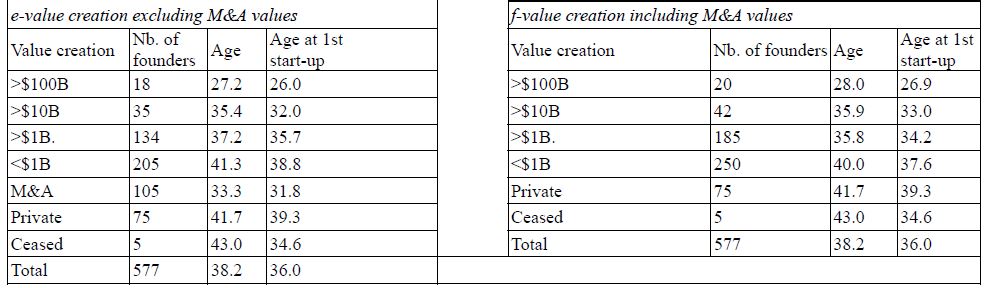
What you will find in common between this recent research and my posts is that there is variation with the field. I am not sure this new research looks at the first entrepreneurial activity and it would make sense as their emphasis is towards experience. I also had different answers about the impact in value creation in my research with this striking illustration:
All this drives me to a second line of thinking:
– the importance of creativity: check #creativity.
– the importance of experience: I had a piece of research with strange results many years ago about serial entrepreneurs. The end result my be counterintuitive. Check #serial entrepreneur
I will not really conclude but say in the end it depends… except by mentioning Galenson‘s work about conceptual and experimental innovators: “Experimental innovators work by trial and error, and arrive at their major contributions gradually, late in life. In contrast, conceptual innovators make sudden breakthroughs by formulating new ideas, usually at an early age. […] Experimental innovators seek, and conceptual innovators find.” from Old Masters and Young Geniuses. This could be an answer to the authors’ question on the choice of VCs: they would be looking for conceptual innovators.