A final post (for now) about the data about 600 (former) startups. So what have they become today in April 2020?
First a quick point of caution: I counted some companies twice, because I had looked at their equity strutcure at different points in time: Alibaba had two IPOs in 2007 in HK and 2014 in the USA, Esperion had 2 filings in 2000 and 2013. This is not a big deal, except if you count Alibaba’s value twice!
So out of the about 600 former startups, I found that
– 20 were still private (they may have recently filed for IPOs though)
– 12 were private again after an IPO
– 13 had stopped their activity (often through bankruptcy)
– 225 had been acquired or merged with another company (Merger and acquisitions – M&As)
– 331 were still public.
So let us have a closer look at M&As and public companies:
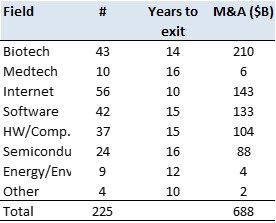
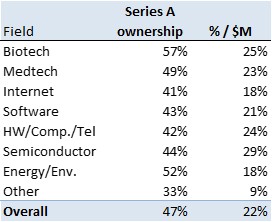
On the M&A side, the main acquisition value comes from biotech, with a $5B average value whereas software or internet is a little les below $3B.
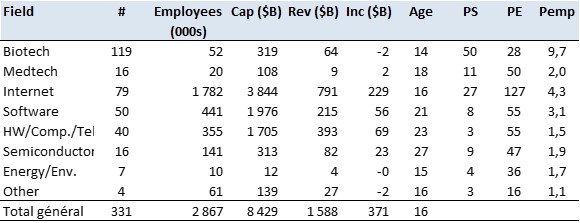
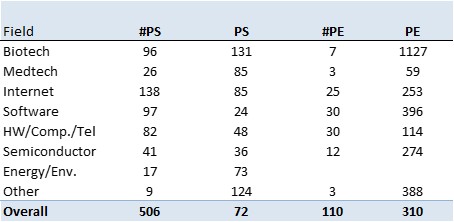
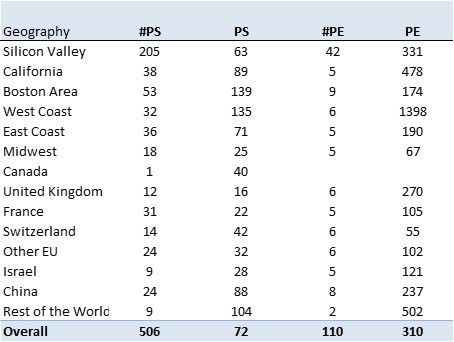
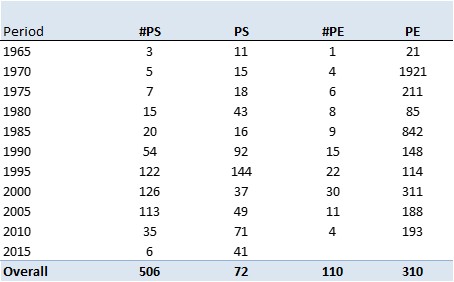
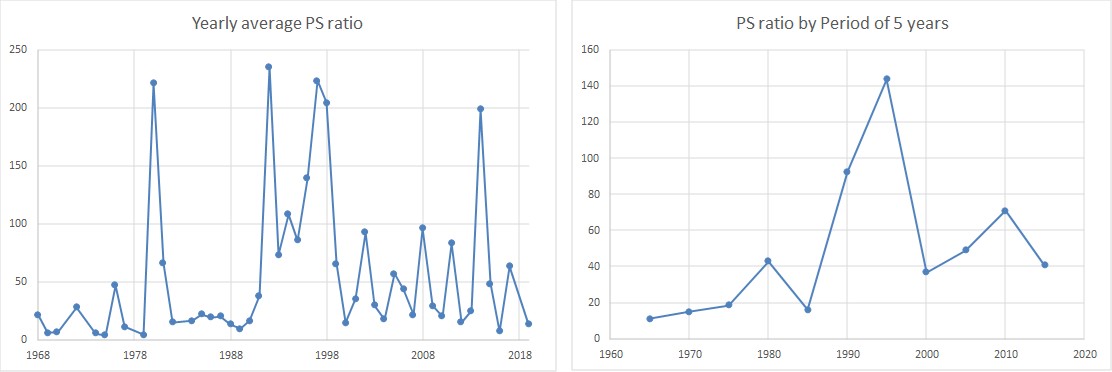
On the public side, I will let you discover depending on your interest about, given the field, the number of companies, employees, cumulative market capitalizations, sales, profits, then age of companies and current average price to sales (PS), price to earnings (PE) and an interesting personal metrics, price ot employees in $M (Pemp).