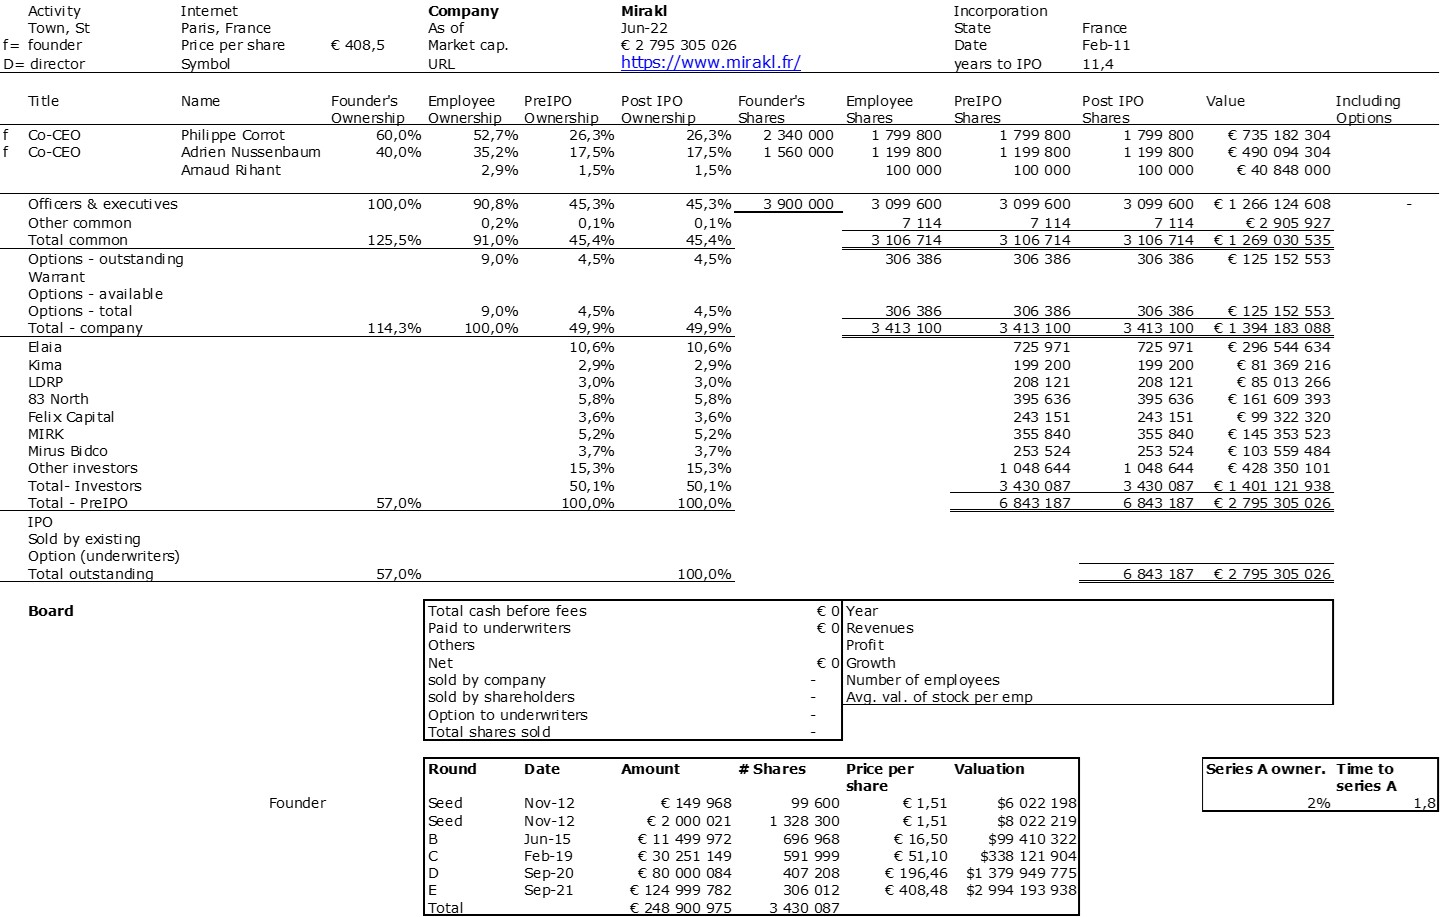
Figma is the latest startup success story. Not an IPO, there are so few in 2022, but a $20B acquisition by Adobe. I did not have much data to build its cap. table so this is mostly tentative. Still it is interesting. So here it is. However there is much more to the story of its founders Dylan Field and Evan Wallace. Read below.
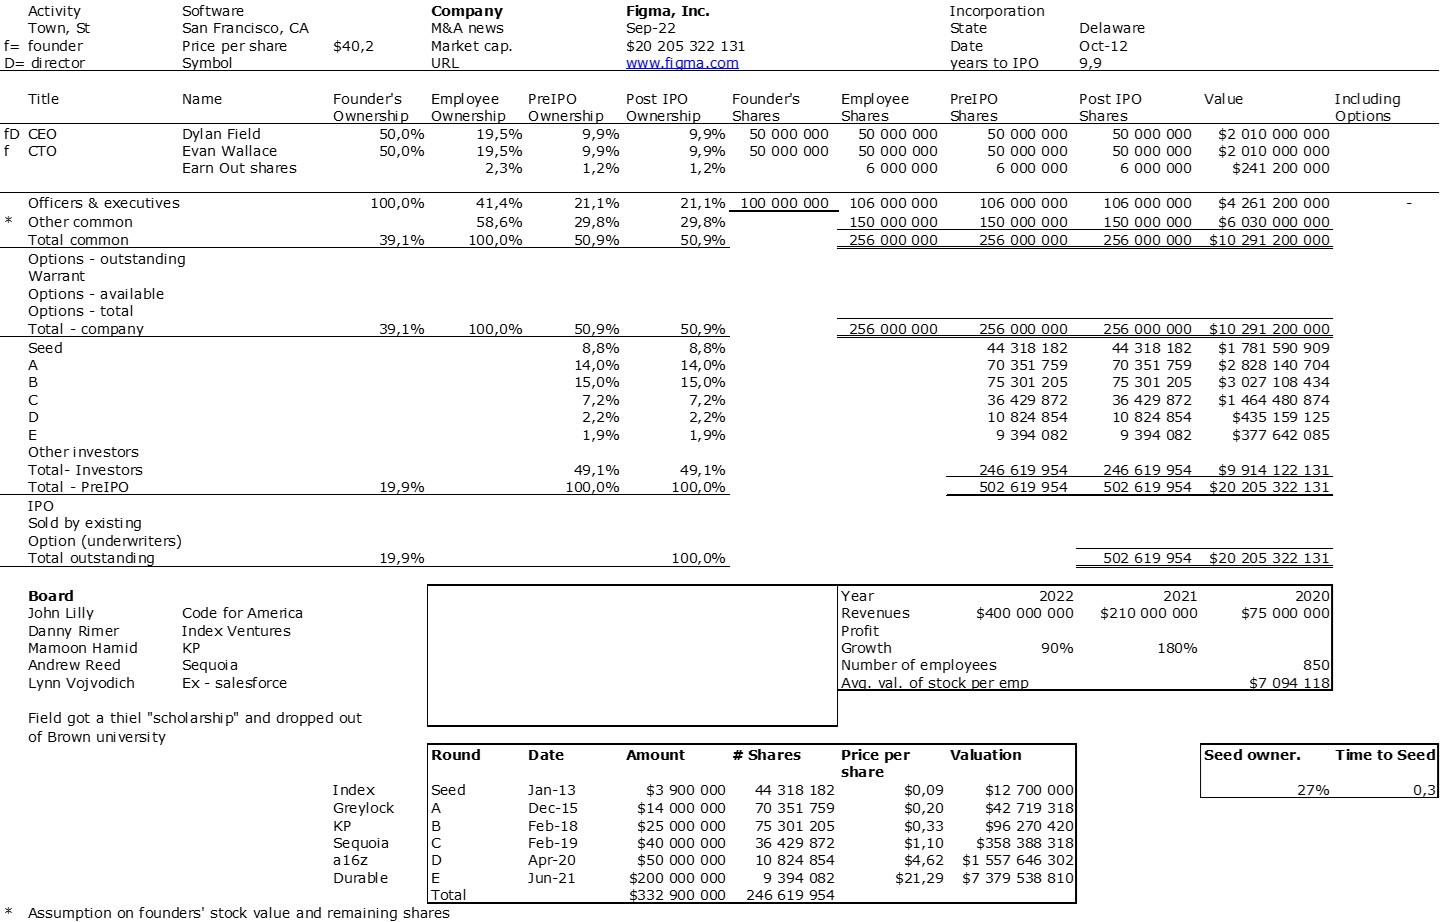
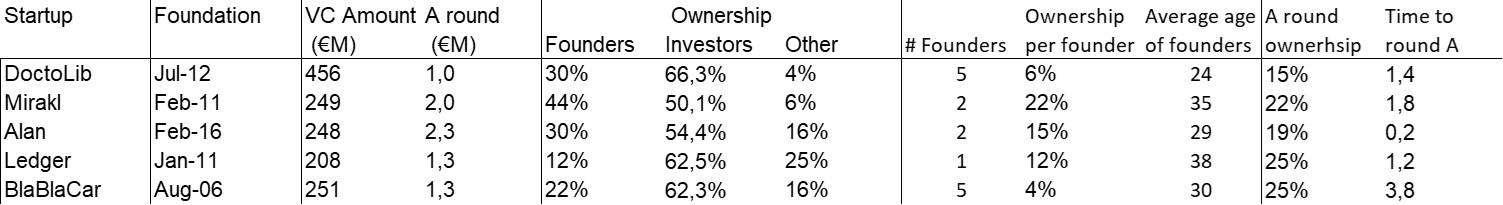
Not much to add to the numbers except the founders (including possibly some earnout shares) & investors stake, 20% & 50% respectively as well as the time it took for all this. A few months for seed, 10 years for an exit.
 Photographer: David Paul Morris/Bloomberg
So let us have a look more specifically at Dylan Field. Again the typical even if rare school drop-out in his early twenties who is still the CEO 10 years later. His cofounder is a friend. The rest is history. Well not really. Read his Wikipedia page for more or this article from Business Insider.
First, Field received the $100k that Peter Thiel was offering to young students ready to drop out of school. Field’s parents were against the idea but Field dropped out of Brown University. I have always been intrigued with the idea of pushing people out of school. Will Field ever go back there?
Second, he found some VC money despite the fact that Field recalled that he experienced a “wake up call” when [a potential] investor turned down the chance to invest in Figma’s seed round and said, “I don’t think you know what you’re doing yet.”
Third, he remained as CEO despite his lack of business experience. At one point early into Figma’s existence, Field said he once faced the very real risk of an exodus of disaffected employees. He had to learn, quickly, how to be more open to feedback and to empower his teams, while also hiring experienced managers. “I didn’t know how to manage effectively,” he said. “I didn’t know the basics around how to have good judgment around who to hire. When we were 10 people, I was a year into management. Usually if you are a new manager, you manage a few people. I was trying to do this at the same time and get the product to market.” Apparently he survived a few crises and the VCs let him lead.
There is certainly much more to learn from this unique story, but it is enough here. One final point. I would love to know more about VC performance. I worked at Index in the early days so I learnt that a great success does not guarantee a fund performance. But here Index made apparently more than $2B and made at least a 400x multiple in the seed part of its investment in Figma. But information about VC performance is close to impossible to find…