Third post of comments on the 600 startup data. As I am not sure how many posts I will write about this, I created a tag #600startups.
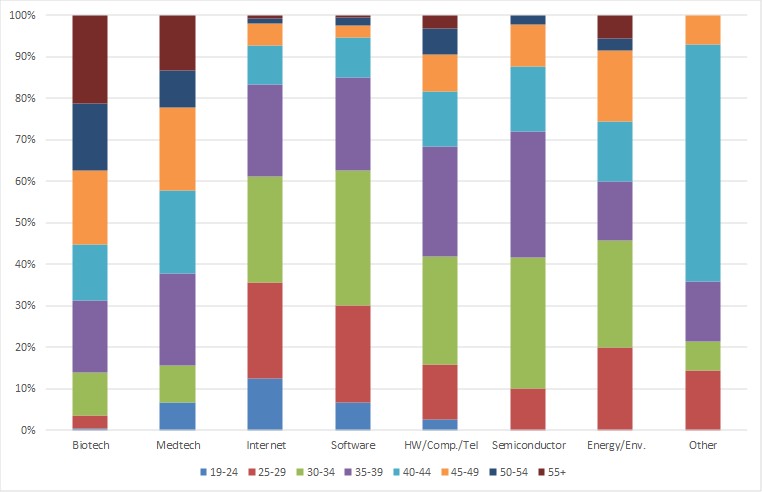
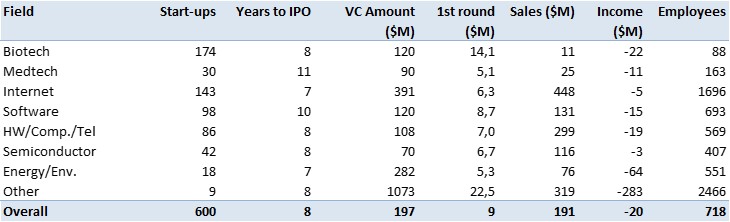
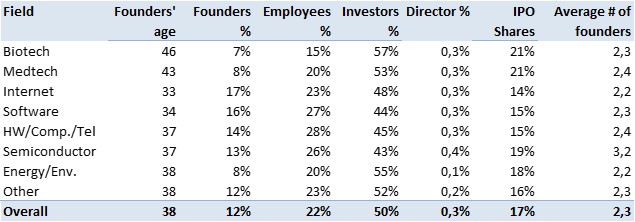
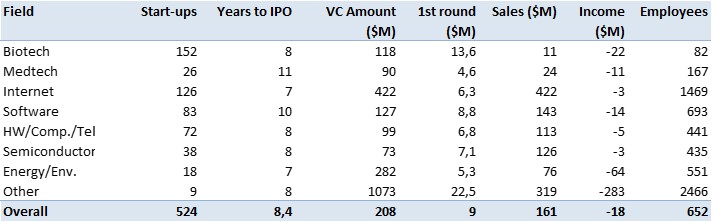
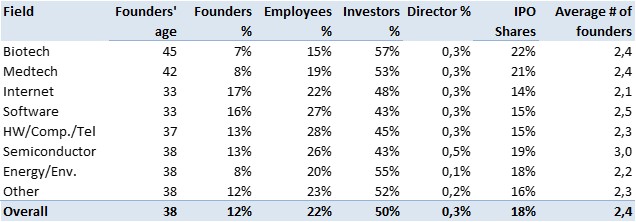
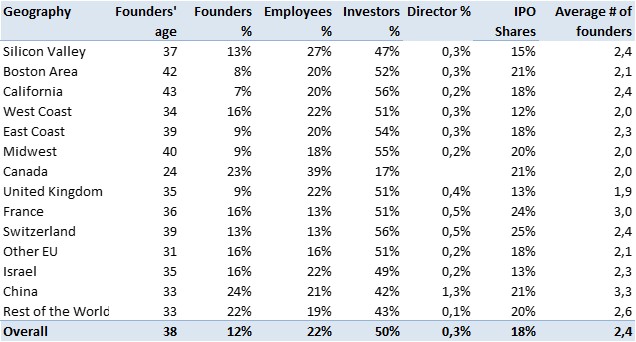
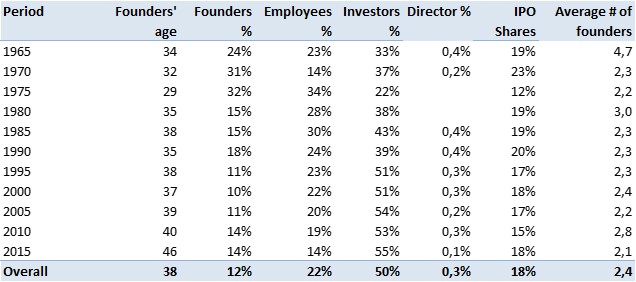
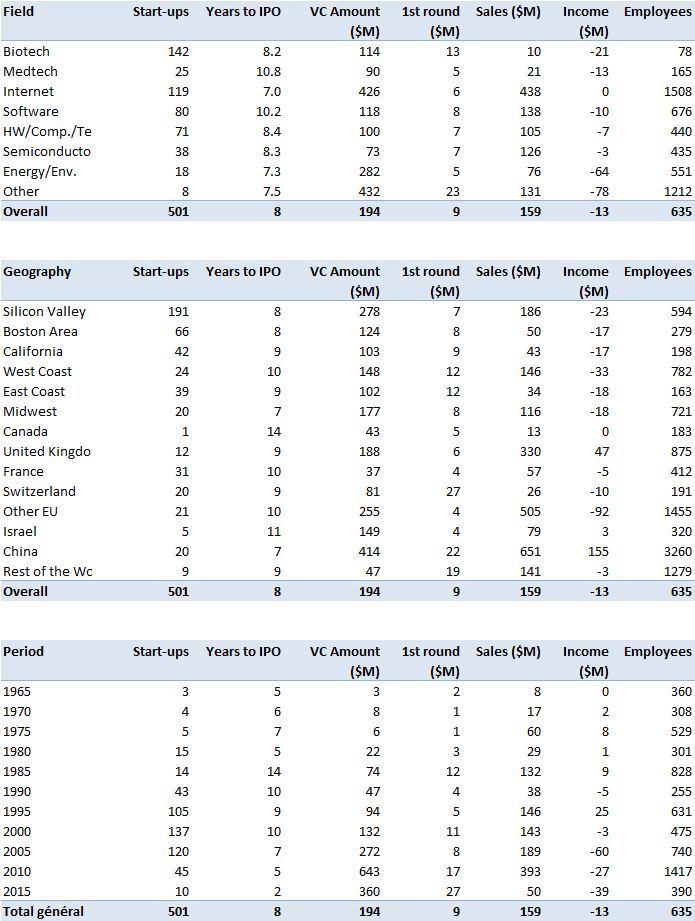
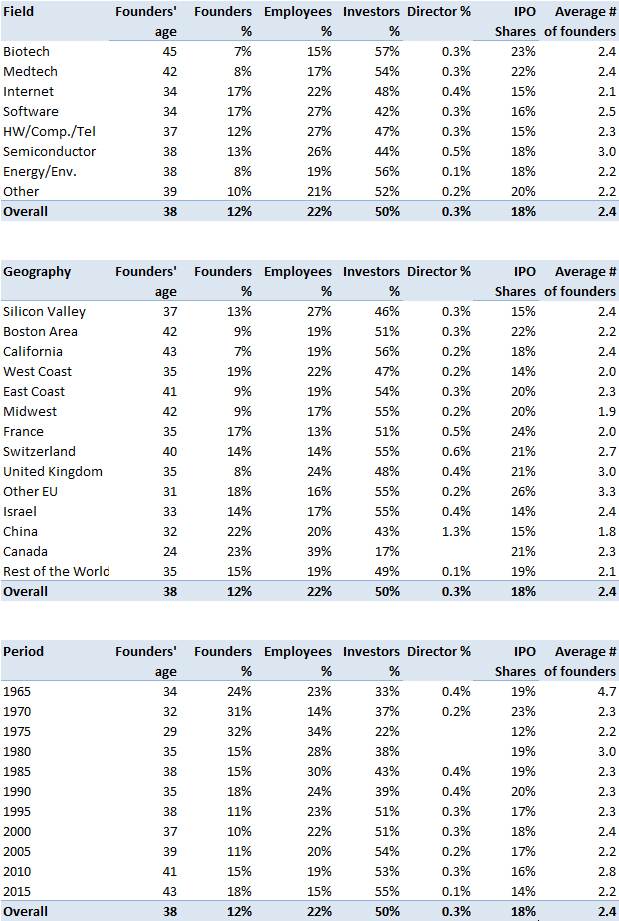
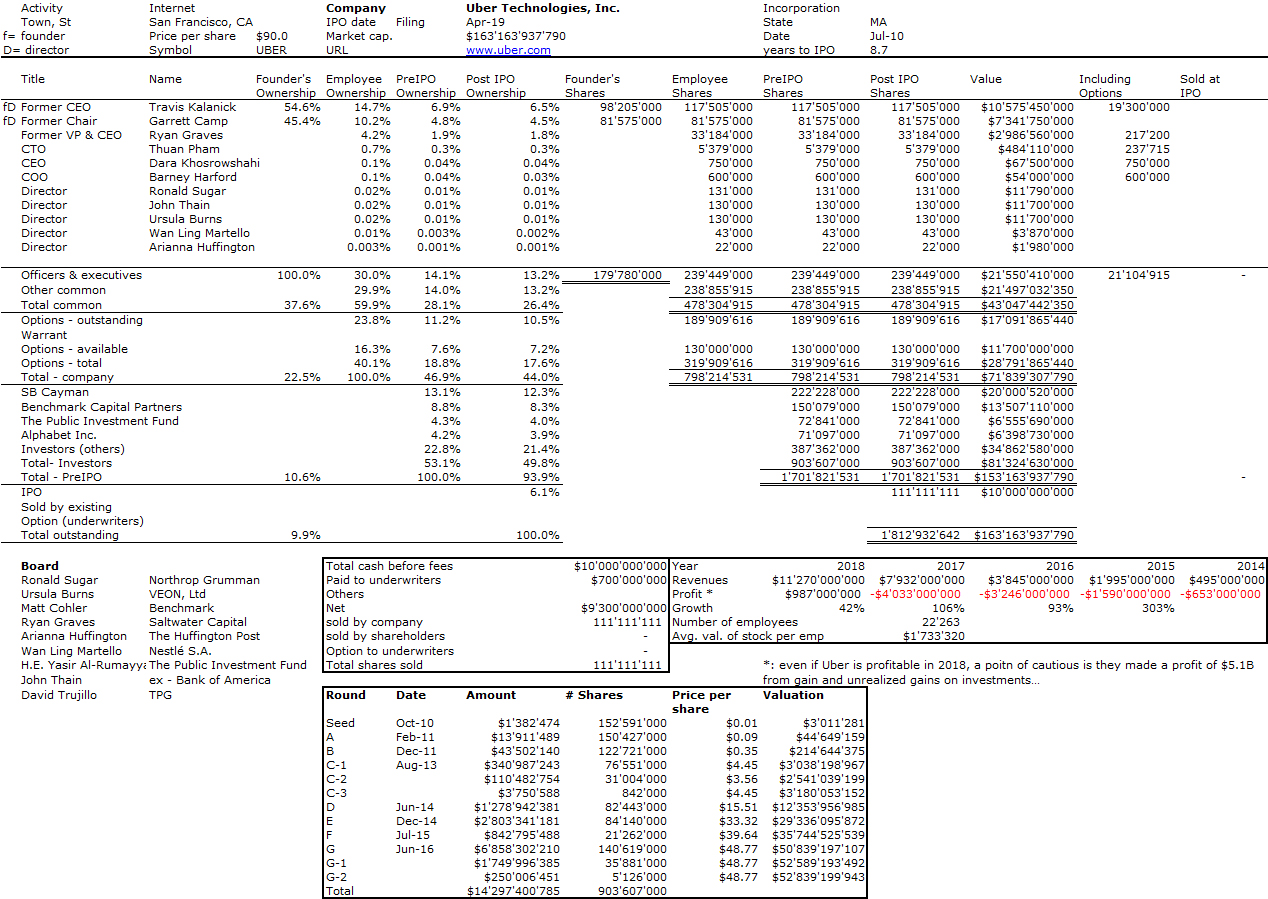
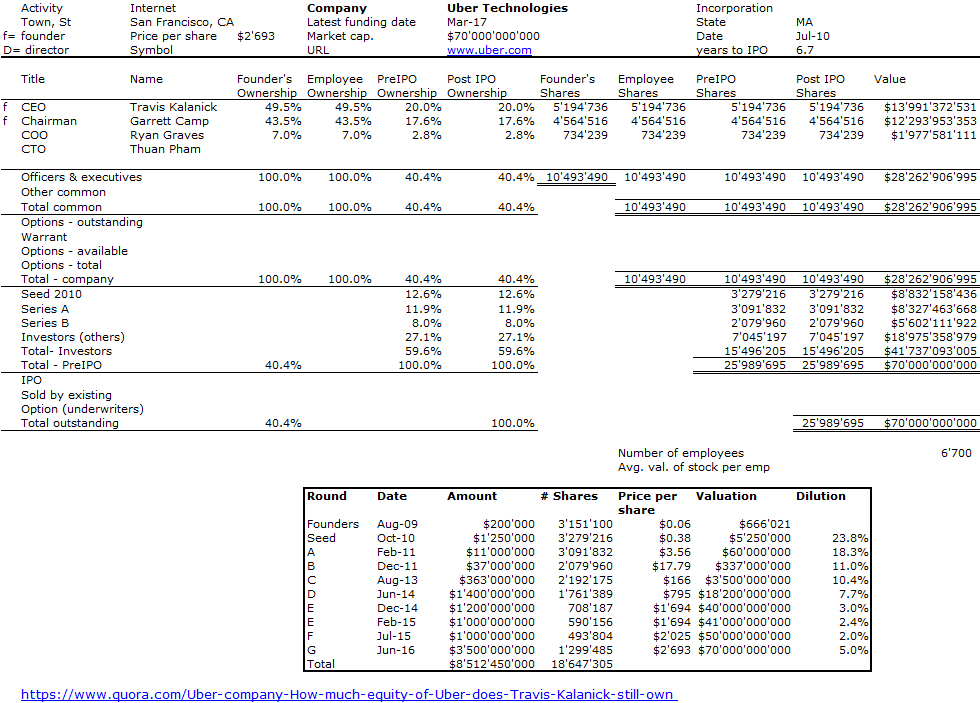
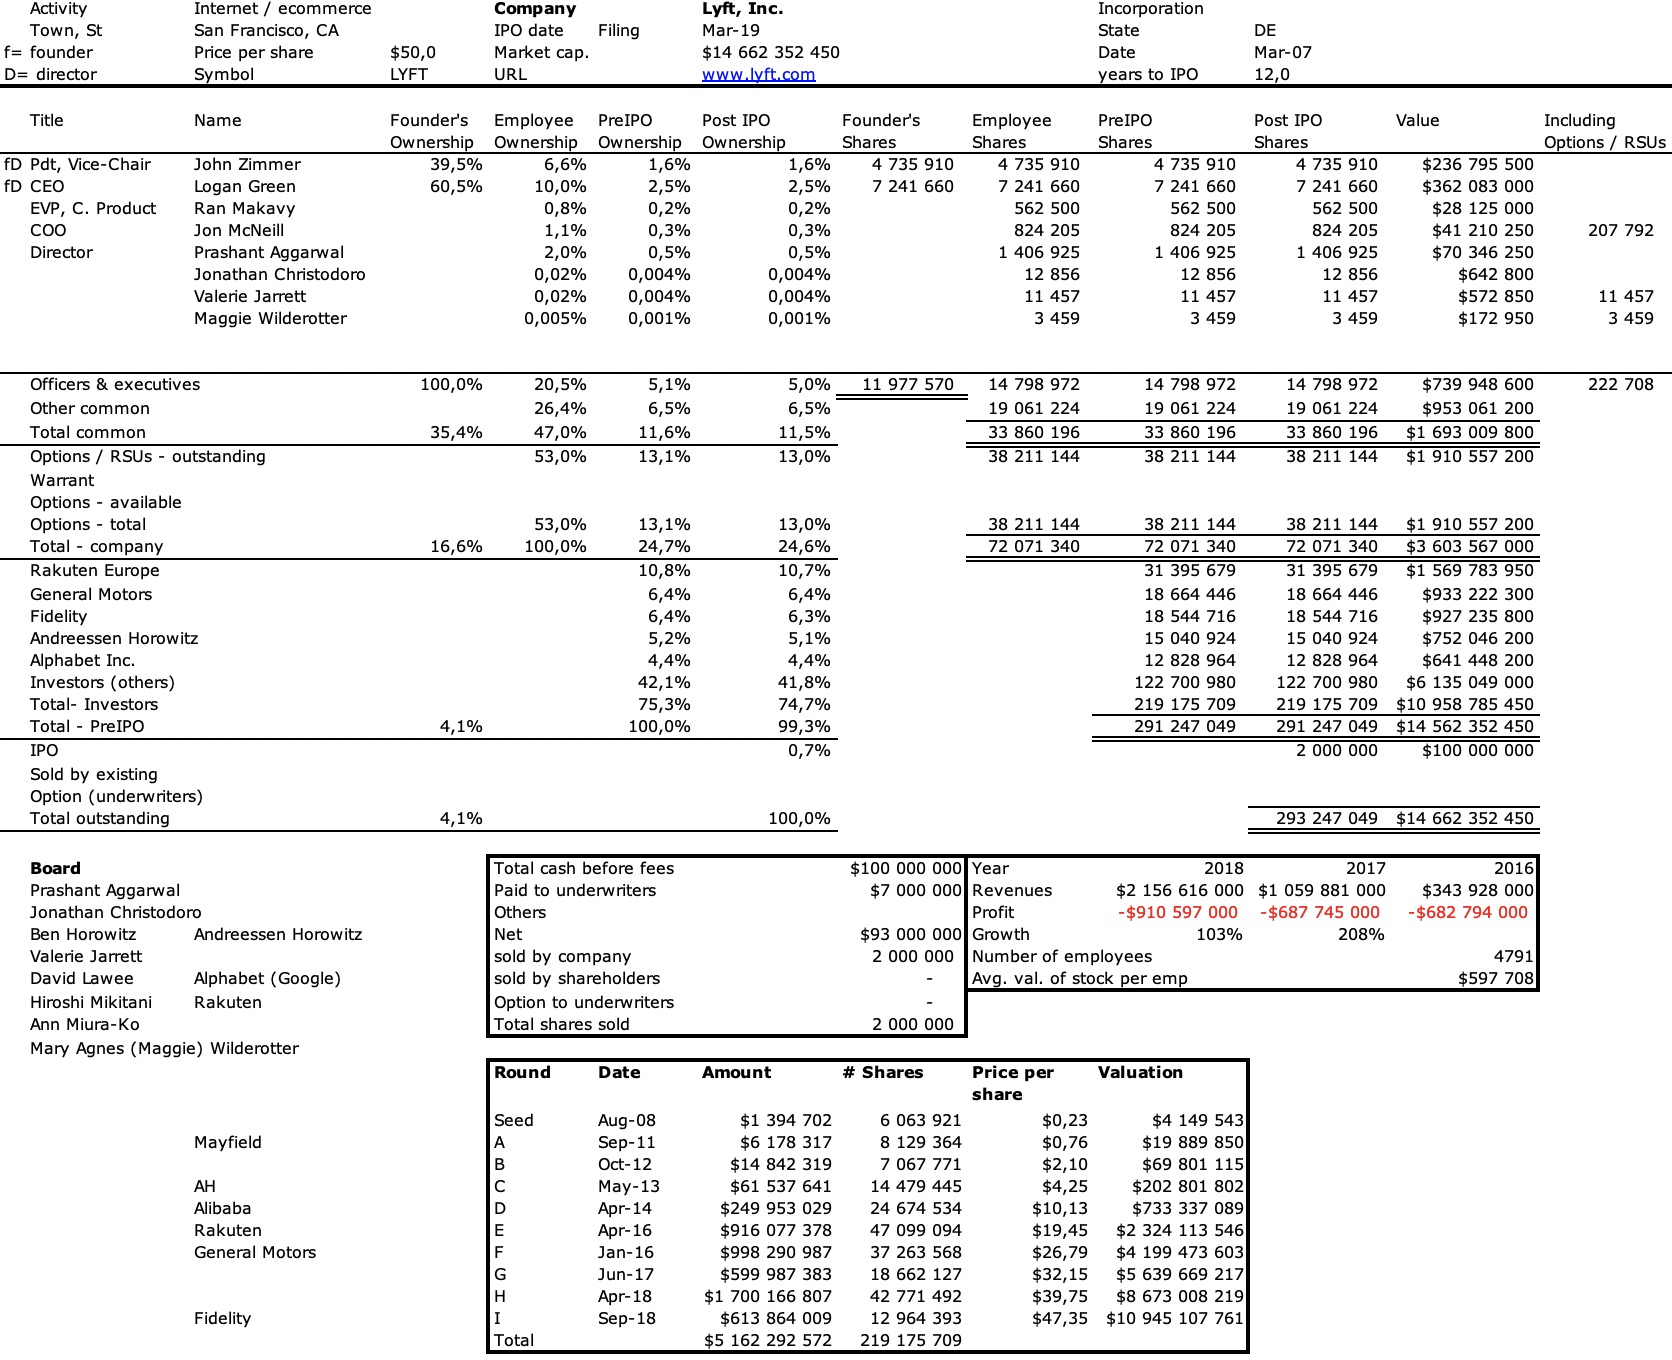
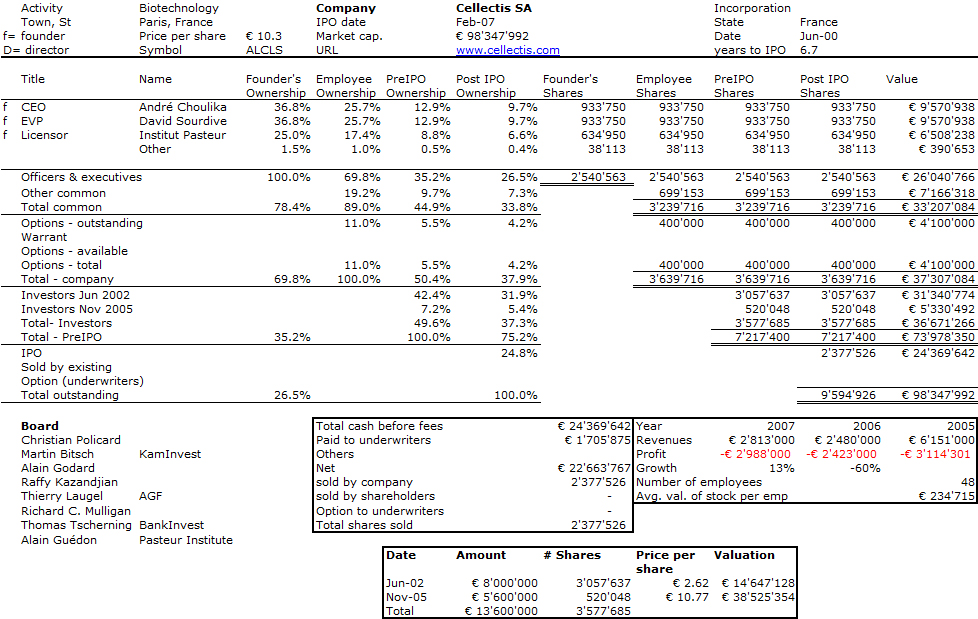
I looked at the founders’ age yesterday; today it is about their ownership over time. Founders keep 12.5% of the company at IPO, a little more in IT (about 16%), less in health (7-8%). The median value is 8.5%.
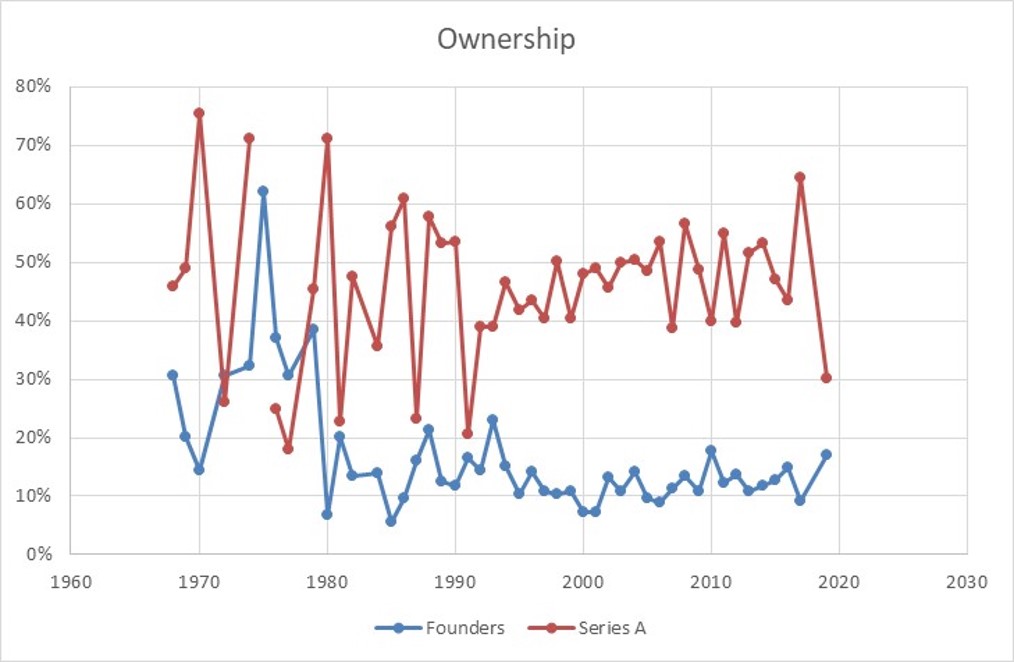
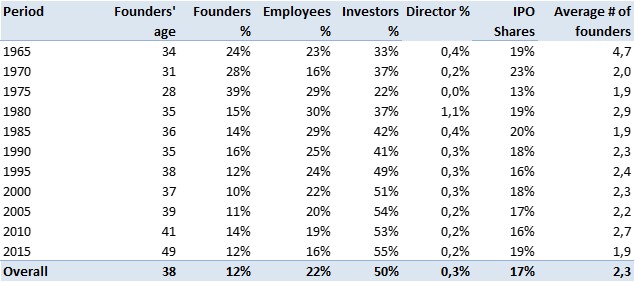
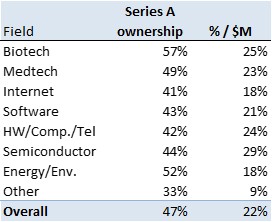
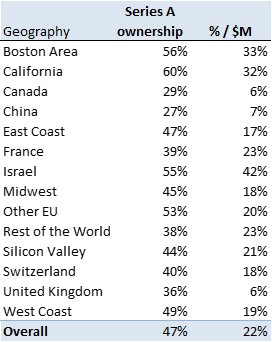
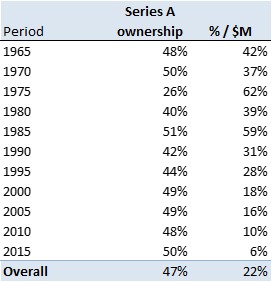
The series A curve is misleading! Founders’ ownership is at IPO but the Series A ownership is at the time of the round itself, not at the time of the IPO…
Moreover, I built a simple model which is the following: the Series A ownerhsip is based on the ratio between their shares and the sum of these shares and the founders shares increased by 20% (this to take into account future hires): as a short illustration, if Series A took 40% in the first round, founders had 50% as 10% was reserved for future hires (i. e. 20% of the founders’ stake).
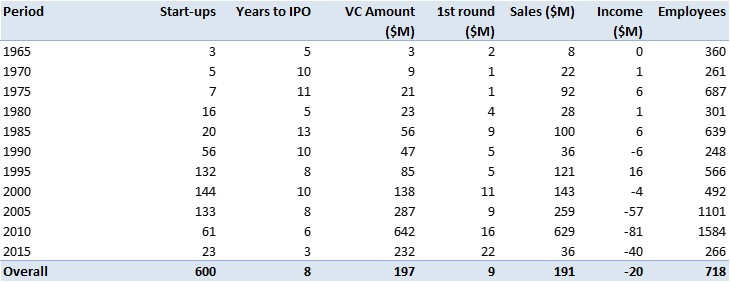
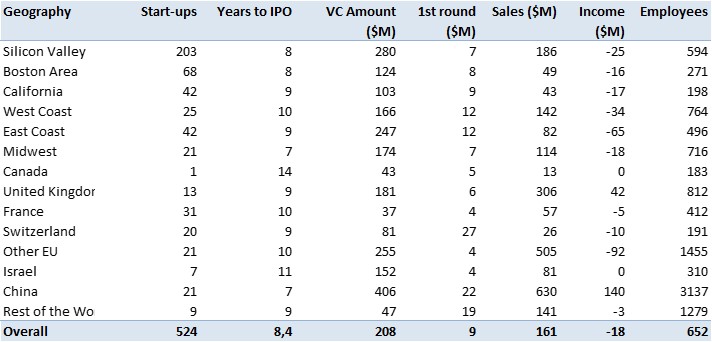
It’s also worth noticing the series A are pretty big, about $9M on average (median value is $4.5M), and possibly in several tranches (as it is quite common in biotech).