I just finished reading *The World of Startups* by Marion Flécher, and I can confirm that it’s an excellent book, even if it’s a bit depressing at times — I’ll come back to that. In a previous post, I described her comparative work between French and “Silicon” startups. But the core of her research deals, on the one hand, with a sociology of entrepreneurs that seems to shatter the myth of the self-made man, and on the other hand, with the internal workings of startups, which are far removed from the sweet and colorful “coolness” of these so-called liberated companies.

A sociology of entrepreneurs
Marion Flécher criticizes the idea that entrepreneurs owe their success solely to their own merit [page 83]. She illustrates this point with the education level of this population. 92% hold a Master’s or Doctoral degree (compared to 27% of traditional business founders). She also illustrates this point by noting that a large majority held salaried positions before launching their businesses [page 87].
Furthermore, all these entrepreneurs benefited from a state-supported ecosystem, notably through the numerous initiatives of BPIFrance (for training, networking, and access to subsidies, without which only those with significant financial resources would launch their businesses). This analysis, reminiscent of Bourdieu, demonstrates that entrepreneurs possess economic, social, and cultural capital.
She convincingly returns to an analogy with the art world: just as an artist doesn’t create a work of art alone in their studio, startup founders don’t create their companies in isolation [page 97].
As a result, the social inequalities of Western societies are amplified here. Gender discrimination, of course: Manon Flécher uses the expression “Entrepreneurship + Technological Innovation = Sexism Squared” [page 109]. But also geographical discrimination: the startup world is very urban and bourgeois. Entrepreneurs from the suburbs, lacking the necessary codes, information, and networks, are rare.
Ultimately, nothing is really new. I experienced similar things in my school and professional life (at a time when social mobility was a reality, a more optimistic and enthusiastic era), and indeed, technological entrepreneurship comes at the end of the path of scientific training and management career.
Entry modalities for entrepreneurship
Her multiple correspondence analysis of startup founders resonated strongly with my own experience in this world. She classifies them into three groups: independent or career entrepreneurs, salaried entrepreneurs or entrepreneurs by opportunity, and young startup founders or novice entrepreneurs [pages 128-131].
The book is essential reading for a nuanced description of this population. Some individuals “seek to rediscover meaning and autonomy; a logic of seeking prestige and social distinction; and a strategic logic that leads them to seize (or not) the opportunities that arise” [page 133]. Others create based on a novel idea with which they hope to “change the world,” which is reminiscent of the Schumpeterian entrepreneur [page 136].
A long personal note, or rather a few notes, at this point in my synthesi of the book. For years I’ve been studying entrepreneurs in my own way. I’ve built a very personal sociology of them, as scientific as possible:
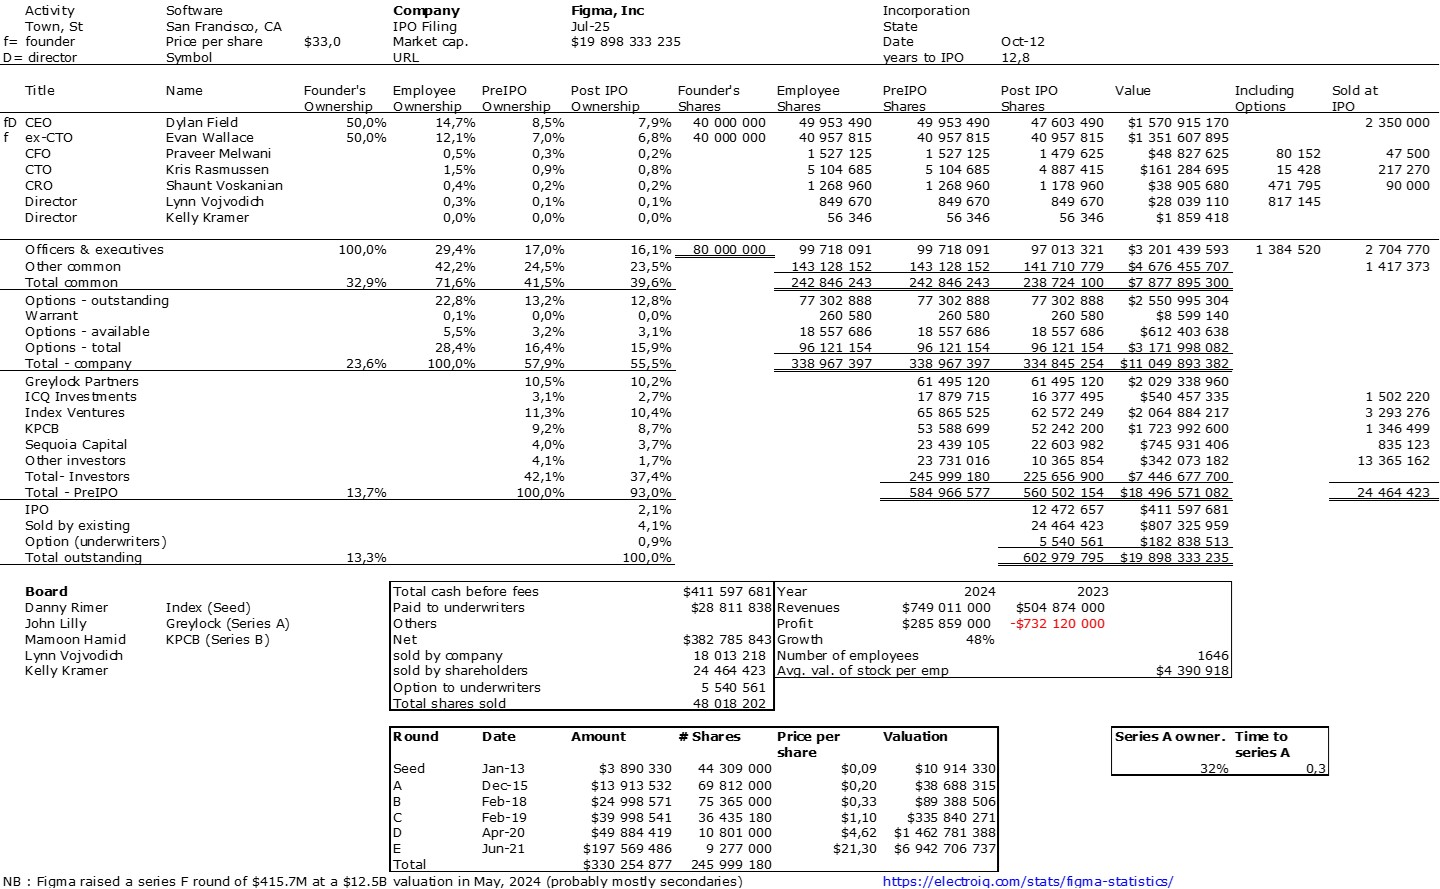
1- It’s undoubtedly an elitist world, even more so if you focus on tech startups. It’s difficult to launch a business without a solid education, often acquired through a doctorate, and self-taught entrepreneurs are very rare. (However, we shouldn’t forget this group: school dropouts who decided to interrupt their studies to embark on this adventure, and Steve Jobs, Mark Zuckerberg, and Dylan Field are a few examples. But be aware, they would undoubtedly have had brilliant academic careers at the best universities had it not been for this interruption.) In fact, my main study on the subject concerns entrepreneurs from Stanford University. Could it get any more elitist?
2- I’ve finally discovered a categorization of entrepreneurs that groups together, on the one hand, novices under 30 and, on the other, more seasoned entrepreneurs aged 30 to 50. It’s quite rare to find such an analysis, and I’ve too often read that entrepreneurs are generally experienced, with an average age of 39. This reminds me of my analysis of “serial entrepreneurs” and, on the other hand, the age of entrepreneurs. Whereas Marion Flécher seems to show (and I hope I’m not mistaken) that in France, experience is an advantage, I’ve tried to demonstrate that value creation is correlated with the inexperience of the founders (who, of course, are not alone as they progress through their ventures).
3- Societal discrimination is a crucial issue. I love mentioning the Lost Einsteins, the Marie Curies lost in Morbihan. I don’t have many more solutions than others to remedy this; I can only observe.
Fortunes and misfortunes in the world of startups
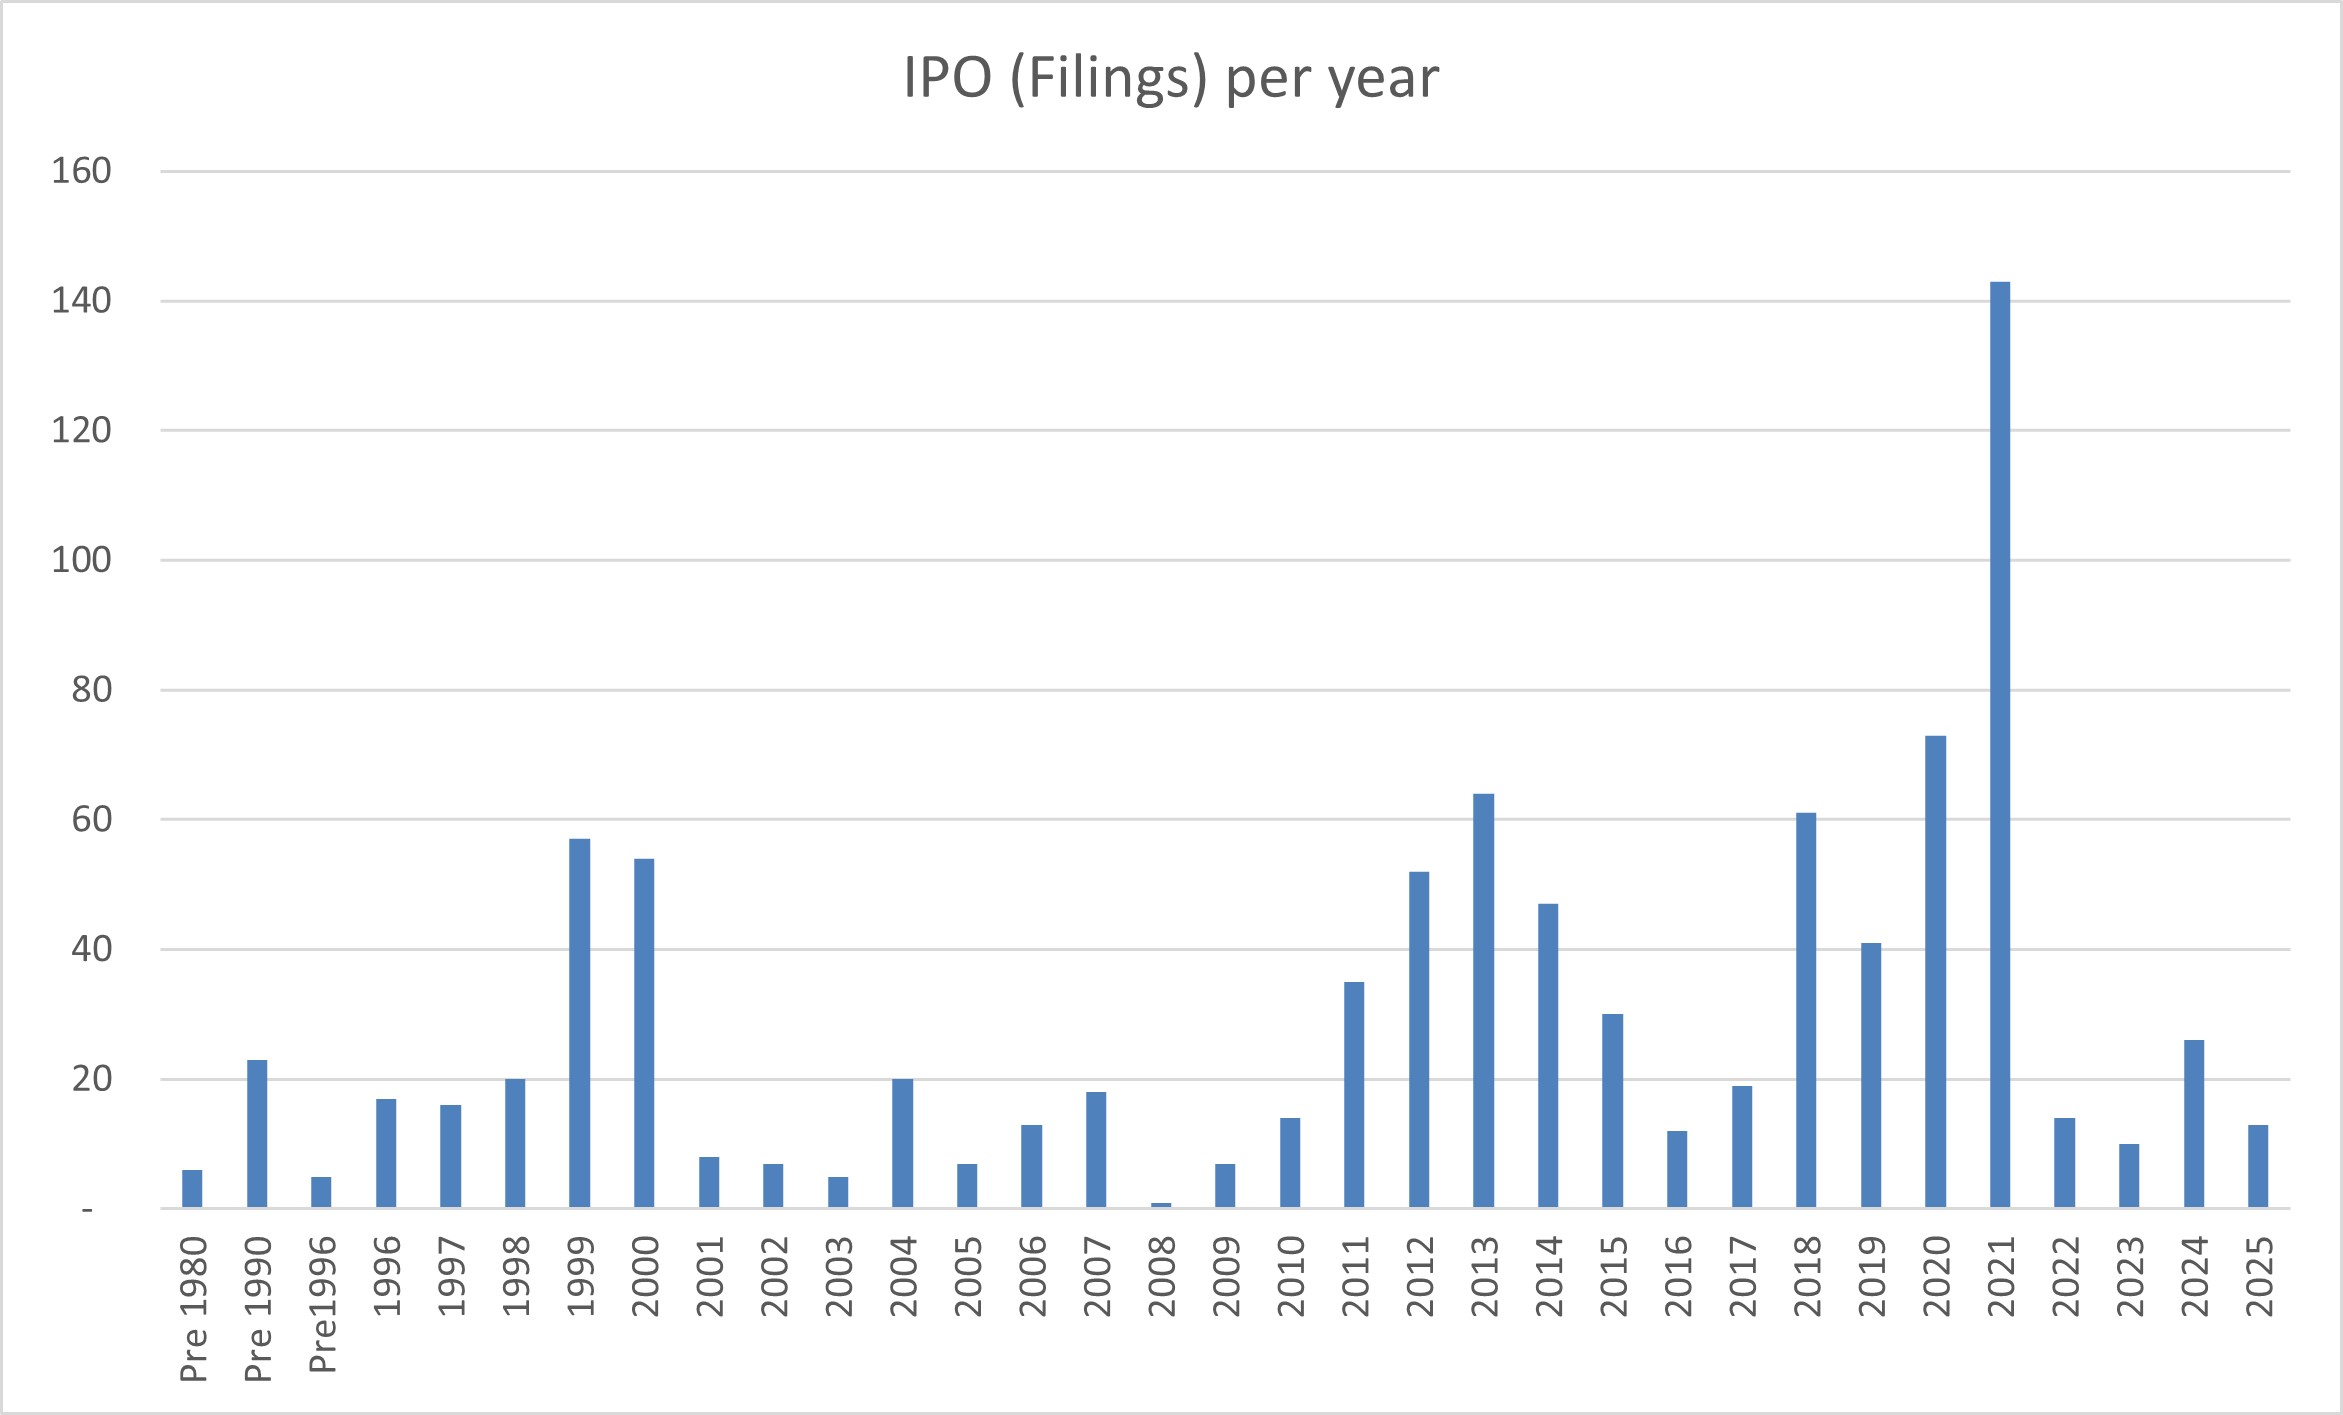
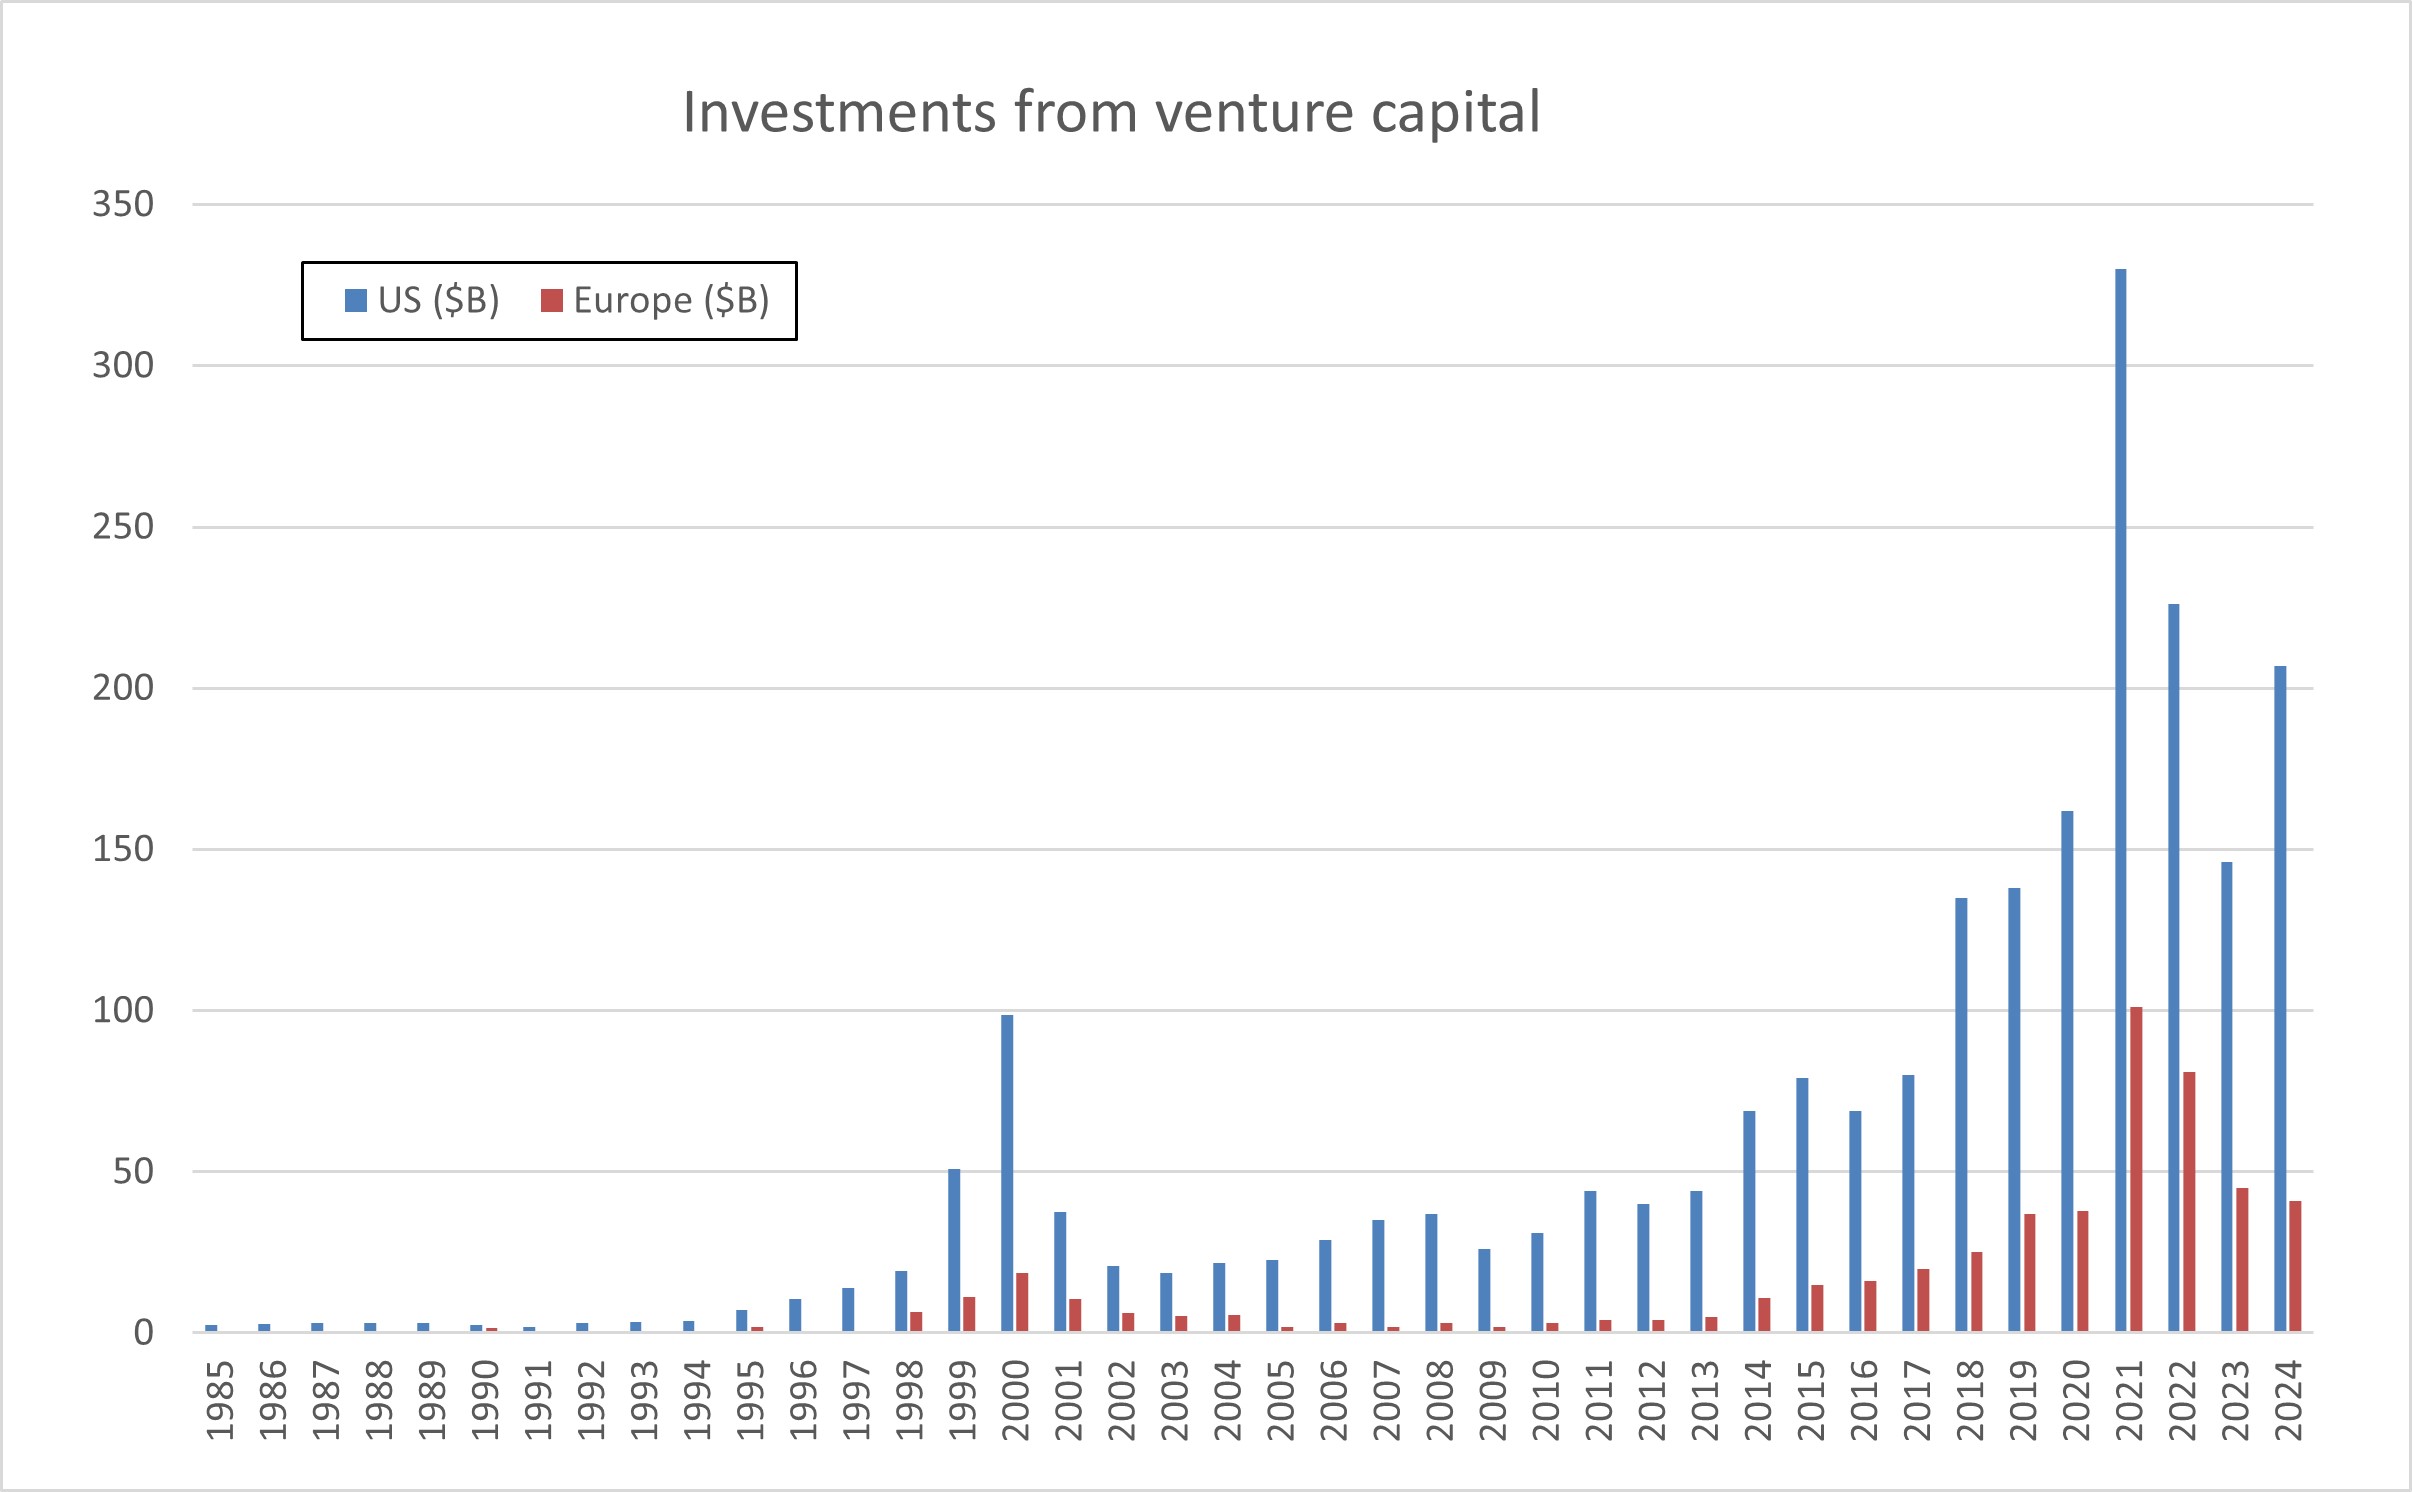
I now come to what I consider the most depressing part of the book. Few innovative companies manage to become sustainable — according to some studies, 90% of startups end up closing or filing for bankruptcy before their tenth year — and even fewer reach the expected growth level to become “unicorns”: only 1% of startups created in the United States achieve this, and only 25 of the 15,000 created in France, or 0.1% [page 147].
The author’s descriptions of fundraising (page 155), growing startups (page 182), and even startups in their early stages (page 204) are sometimes chilling. It’s difficult to deny these realities, even if they are not the only ones. It contains expressions such as fundraising as a test of strength (page 160), co-optation logics unfavorable to women (page 165), making a virtue of misfortune, a strategy of dominant people (page 172), from well-being to control: when moments of conviviality lead to over-investment of workers (page 188), the creation phase: a “joyful mess” not always so joyful (page 205), interns abandoned in the face of demanding work (page 207), a work environment not conducive to the emergence of collective mobilizations (page 228) so that the choice is reduced to “leave or stay” (page 232).
Marion Flécher also notes general advice from the ecosystem that has always struck me as wrong, not to say toxic, at the risk of diminishing the quality and scale of potential successes:
– “In the startup world, failure is both a common and symbolically valued phenomenon” [page 172]; however, I encourage you to read a different perspective from the founder of Zendesk, who doesn’t celebrate failure at all;
– “The ability to pivot is a condition for the success of entrepreneurial projects” [page 173];
– “Startup founders are advised to build teams with complementary profiles; above all, you mustn’t duplicate skills” [page 99]; here again, a different vision of entrepreneurship from Charles Geschke, co-founder of Adobe.
The conclusion: Start-ups, the new face of capitalism
The conclusion is also a bit depressing, so I’ll add a few more personal notes!
Startups are a unique model of companies due to at least three fundamental characteristics (pages 237-243):
– economic, which is not geared towards profitability but towards strong and rapid growth through innovation, made possible by external funding;
– organizational, which utilizes horizontal structures, cooperation, autonomy, and well-being;
– ideological, which values entrepreneurship as the main driver of economic and social progress and merit as the ultimate principle of success and social justice.
But the author’s ambition was to deconstruct these ideals and promises by confronting them with reality. Deconstructing
– the myth of risk and merit, which serves to justify the enrichment of a few by obscuring the decisive role of the State
– the meritocratic myth of the self-made man, which renders inequalities of access invisible
– the myth of the liberated company, which in reality perpetuates, in renewed forms, logics of exploitation, control, and segmentation of the workforce.
More personal comments: the power law and the exceptional nature of this world?
The analysis is correct, but isn’t the picture painted too bleakly? Everyone should form their own opinion, and the facts should help. I’m even surprised that Marion Flécher didn’t cite Mariana Mazzucato and her book, *The Entrepreneurial State*.
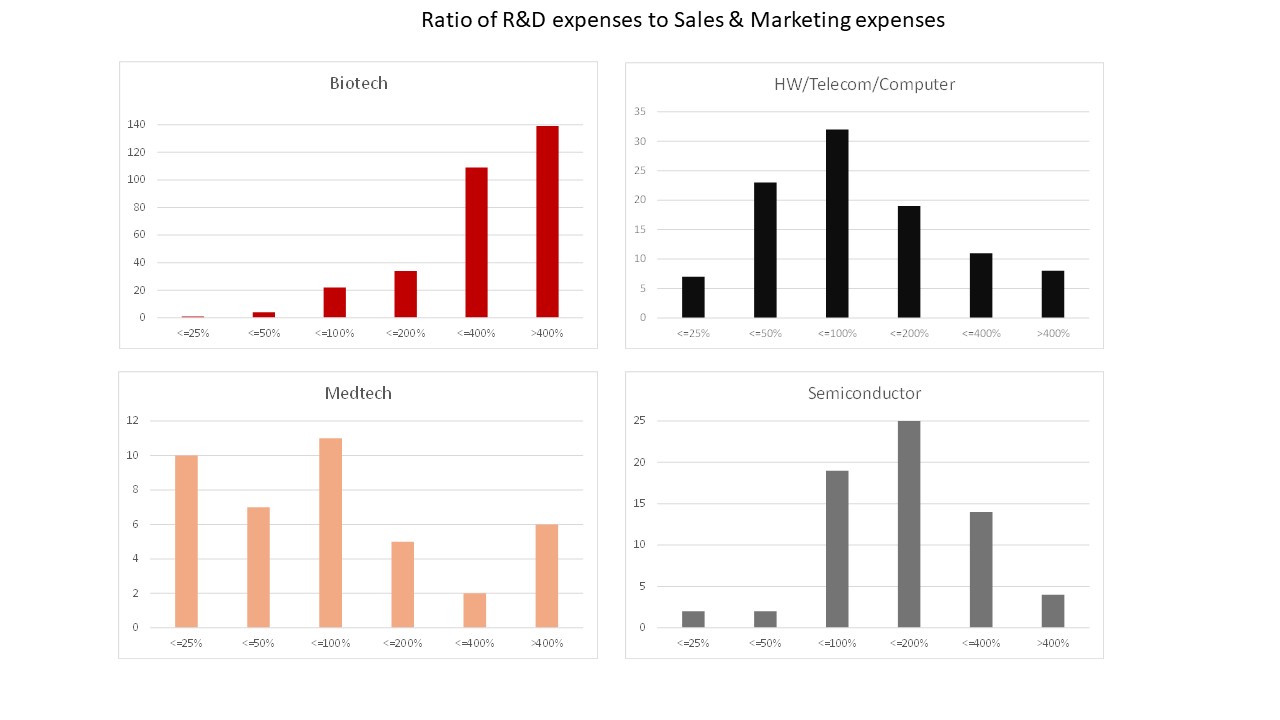
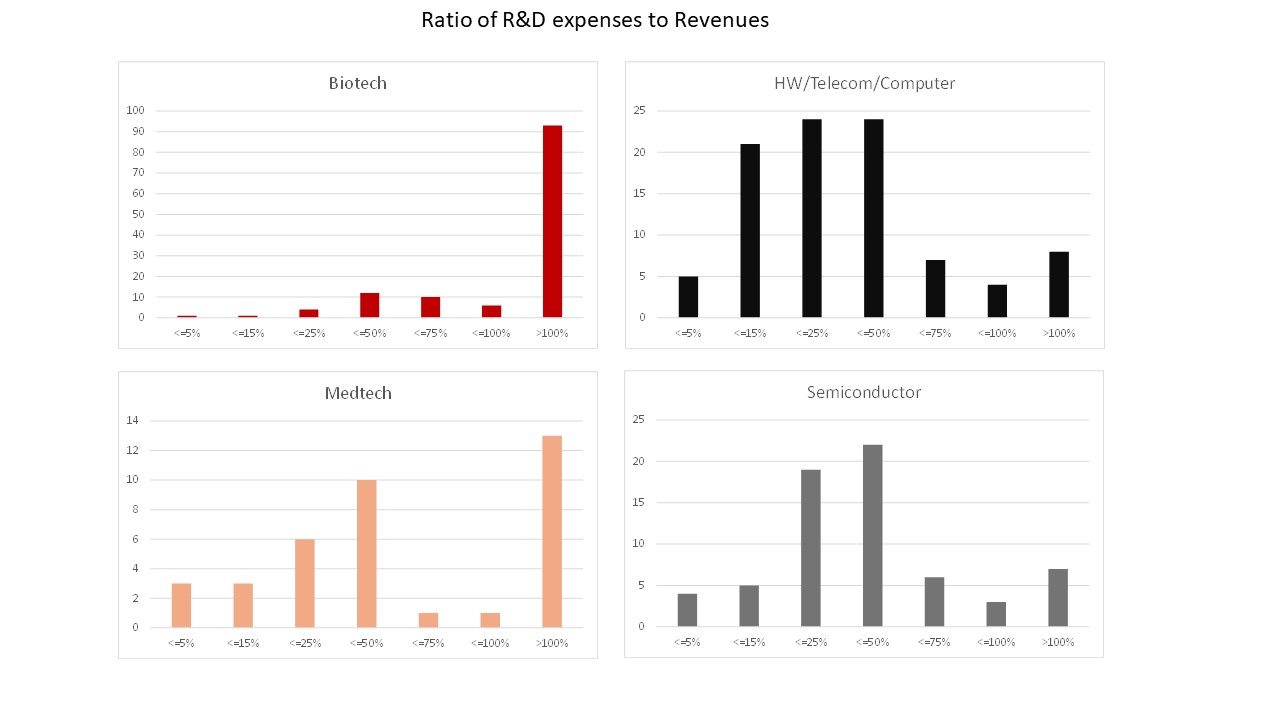
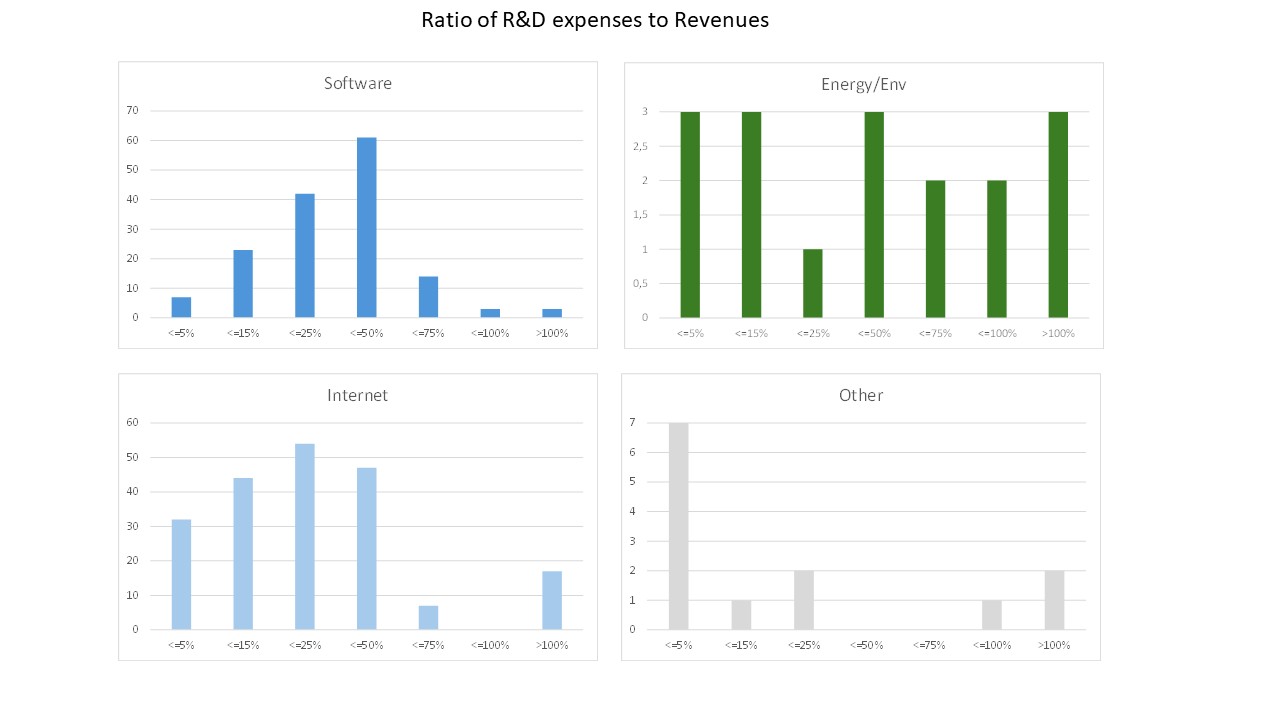
The debate surrounding this undoubtedly abnormal world, like the art world for that matter, is not surprising. It’s full of exceptions rather than averages, to the point that some believe Gaussian statistics don’t apply. Power law should be used instead.
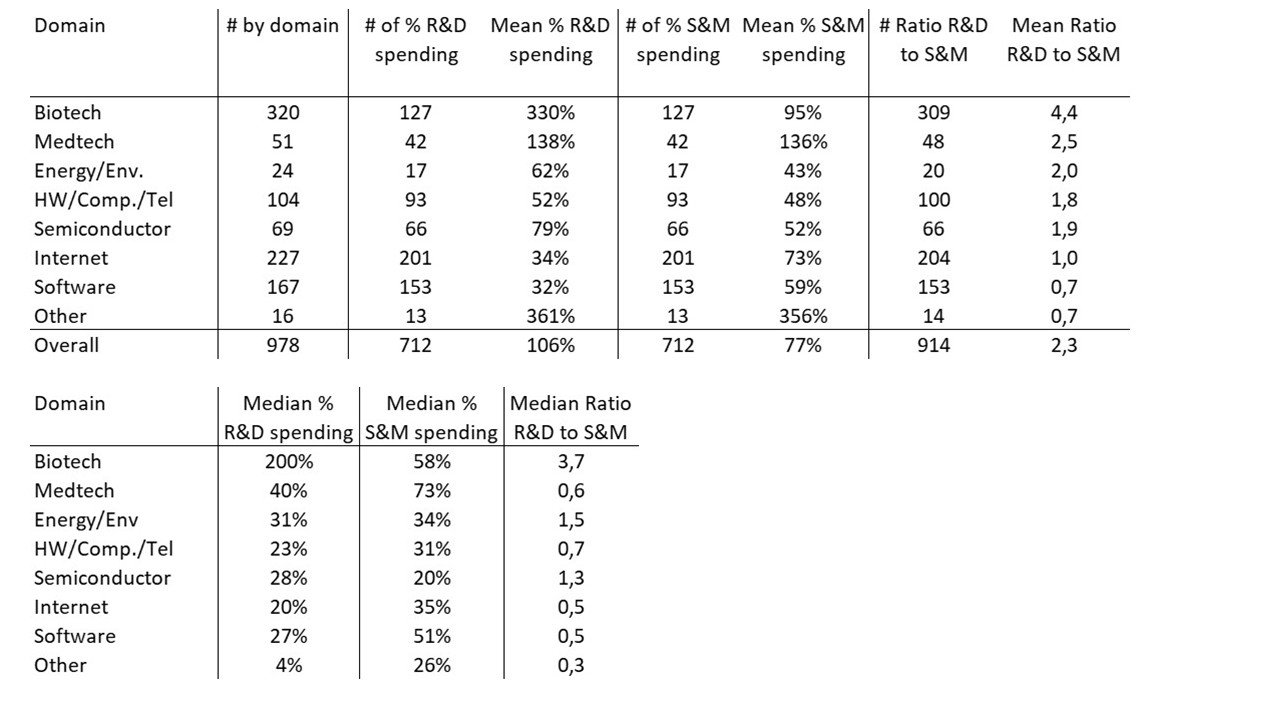
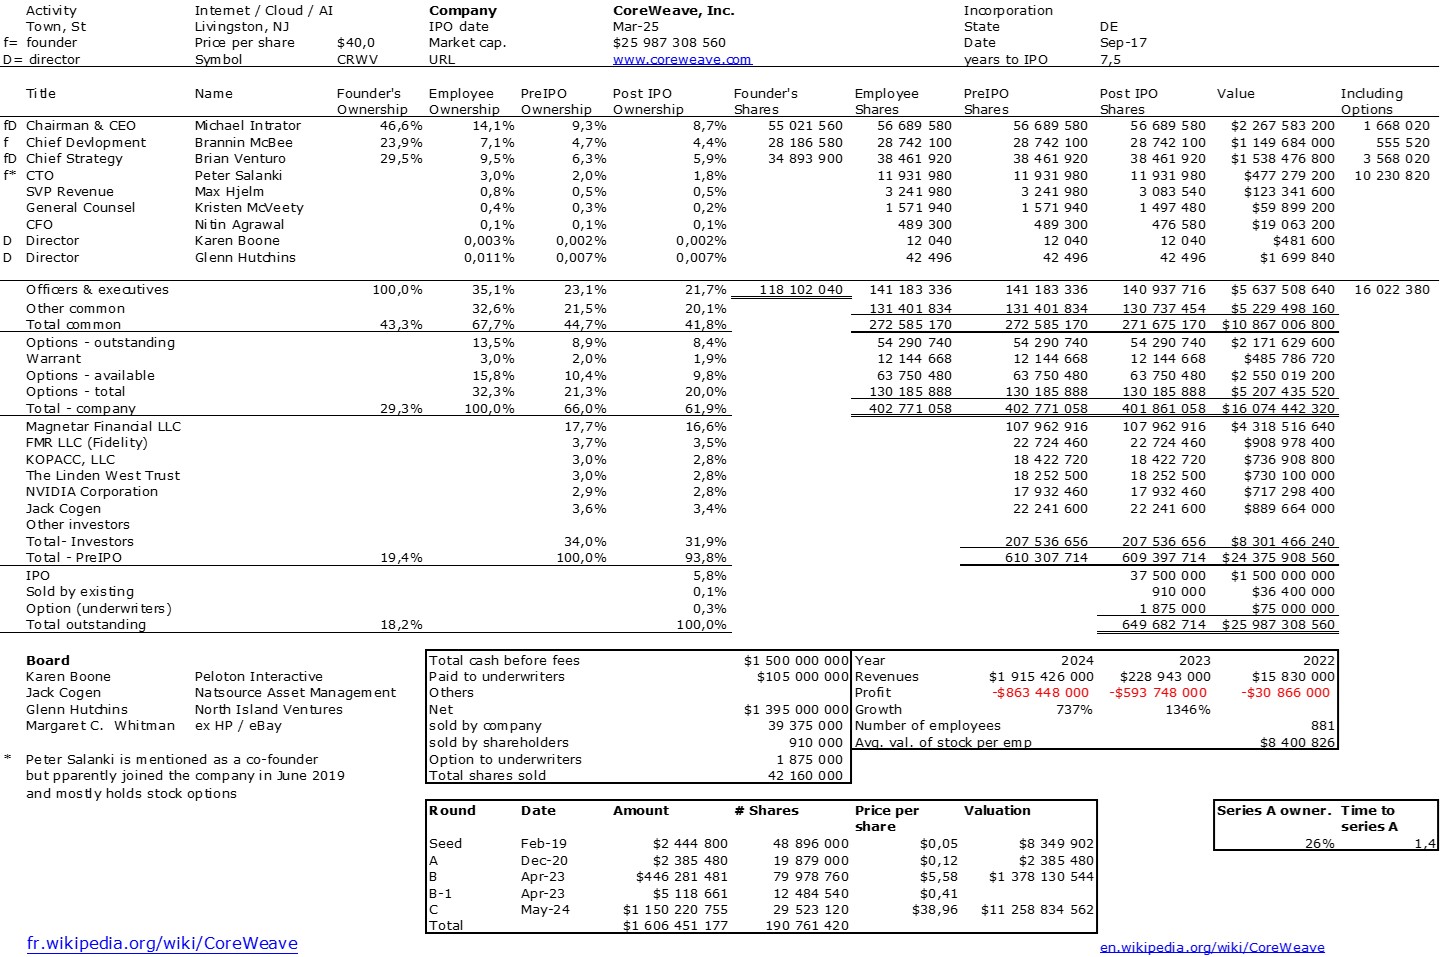
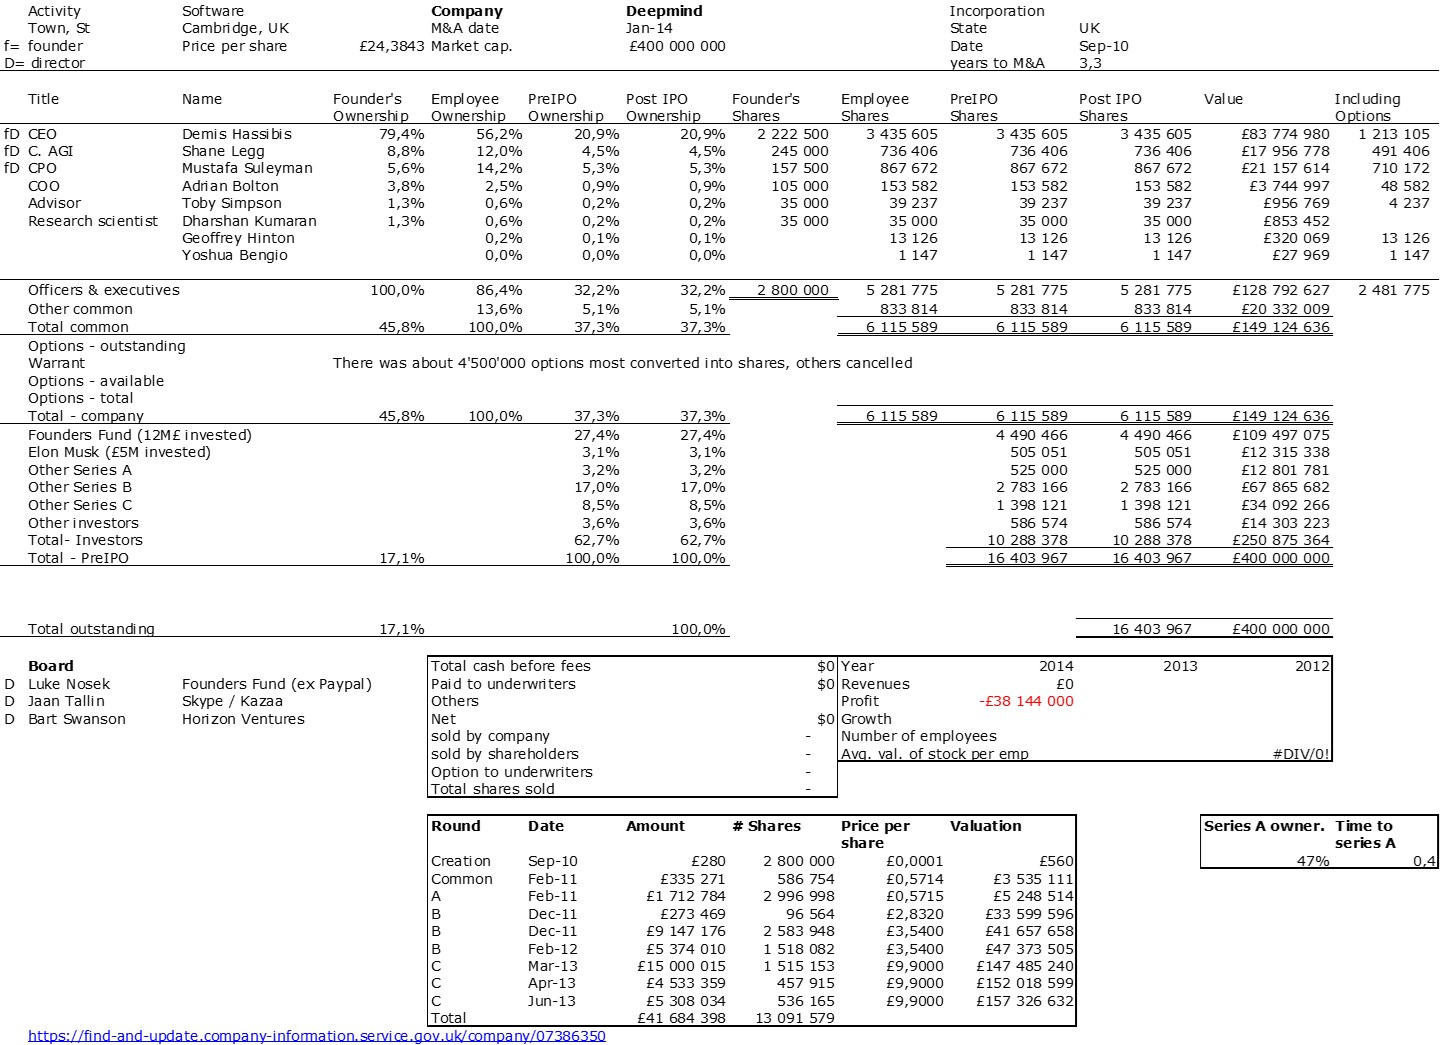
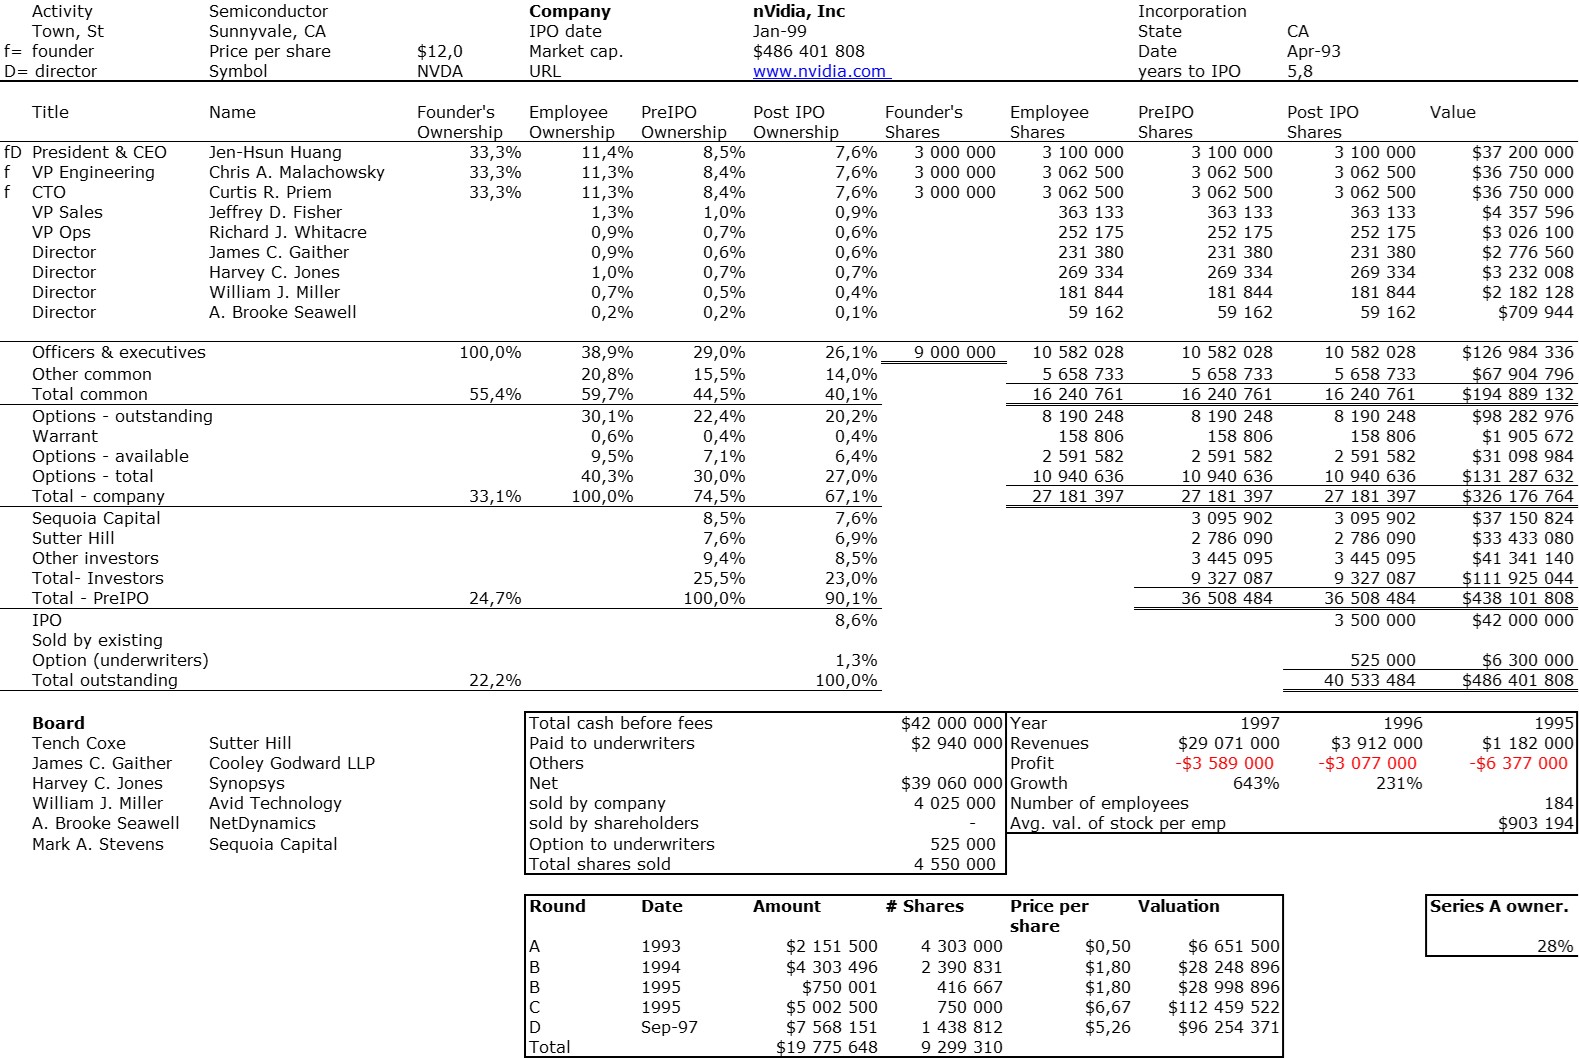
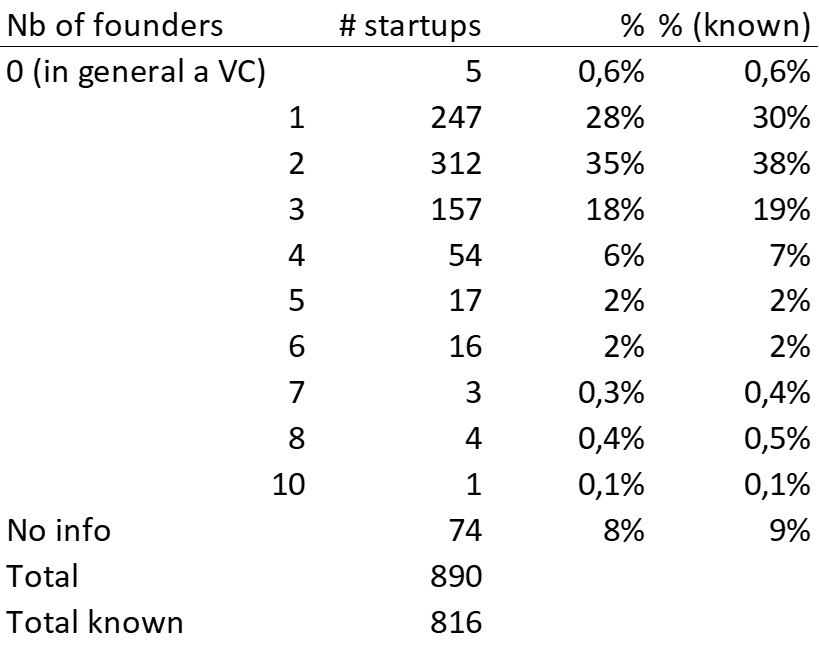
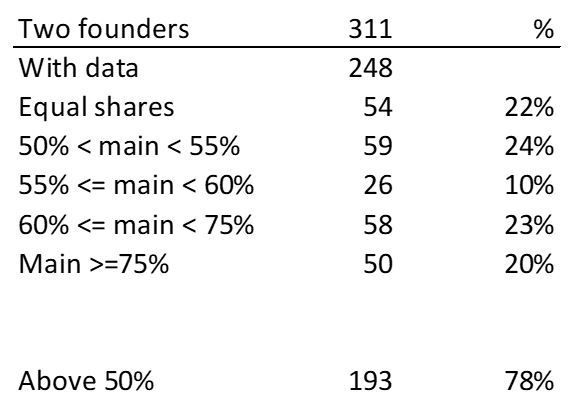
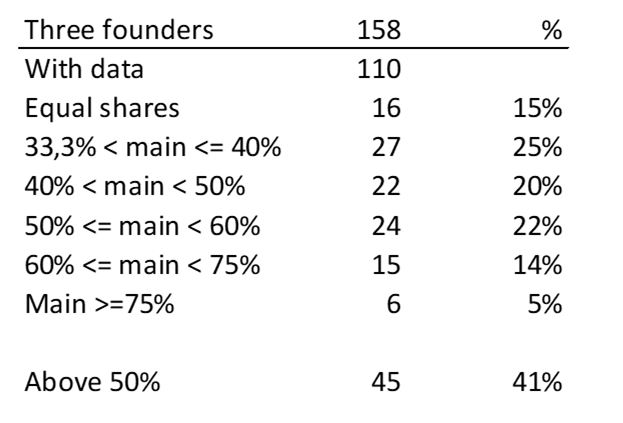
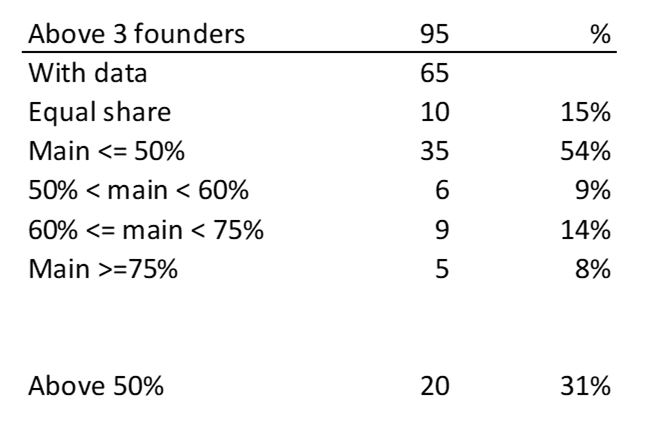
We’re closer to a (more or less absolute) monarchy than a democracy. Founders are practically kings. Additional note: in my data on nearly 1,000 startups (961 to be precise, as of today), 60% of CEOs are founders, and even 70% in the software and internet sectors. And only 40 CEOs are women… (and even worse, 88 female founders out of 1,733 male founders).
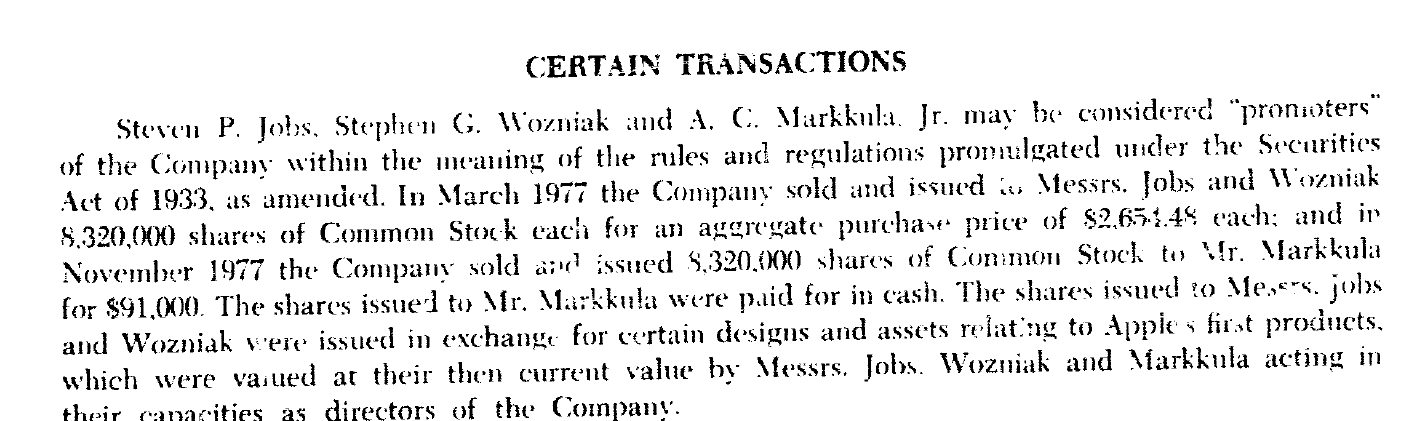
In fact, neither entrepreneurs nor investors behave in a completely conventional way. Take, for example, the founders of Apple: The two of them did not make a good impression on people. They were bearded. They didn’t smell good. They dressed funny. Young, naive. But Woz had designed a really wonderful, wonderful computer. […] And I came to the conclusion that we could build a Fortune 500 company in less than five years. I said I’d put up the money that was needed.
This is an important book about startups. It’s quite rare in French, and anyone interested in the subject should read *Le Monde des Start-up*.